End Of Bear Market Trading Strategy (Python Code)
In this article, we are going to show you a signal that has a 16% to 20% average return in the SPX a year after it is triggered and hasn’t failed since 1941. It’s called the end of bear market trading strategy.
Having a signal to know when to get back into the market after a huge decline can be very profitable. Distinguishing between a short-term rebound and a change in trend is crucial.
Let’s dive into the explanation, trading rules, backtest, and code of the end of bear market trading strategy:
End of bear market trading strategy – explanation
After a correction or bear market it can be difficult to determine if it’s over or, despite the short-term rebound, it will make new lows again.
This strategy employs the 4-month RSI to confirm this. The RSI is a strength indicator, and it’s usually low(<50) during market corrections.
If it reaches a high level(>60), it may signal that the downtrend is over, and it’s time to buy.
But does the idea work? Let’s backtest it.
End of bear market trading strategy – trading rules
Let’s have a look at the trading rules of the trading strategy:
[am4show have=’p2;p3;p58;p59;p130;p138;’ user_error=’Premium Post Access’ guest_error=’Premium Posts’]
The signal is triggered when the 4-month RSI is greater than 60 following an 18-month low in the previous 18 months.
[/am4show]
Thus, the trading rules are simple, but as you’ll see below, it has worked well, at least until now.
End of bear market – backtest
We backtested the strategy for the SPX since 1927. The data is not adjusted for dividends.
Here is the price of the SPX and signals in a chart:
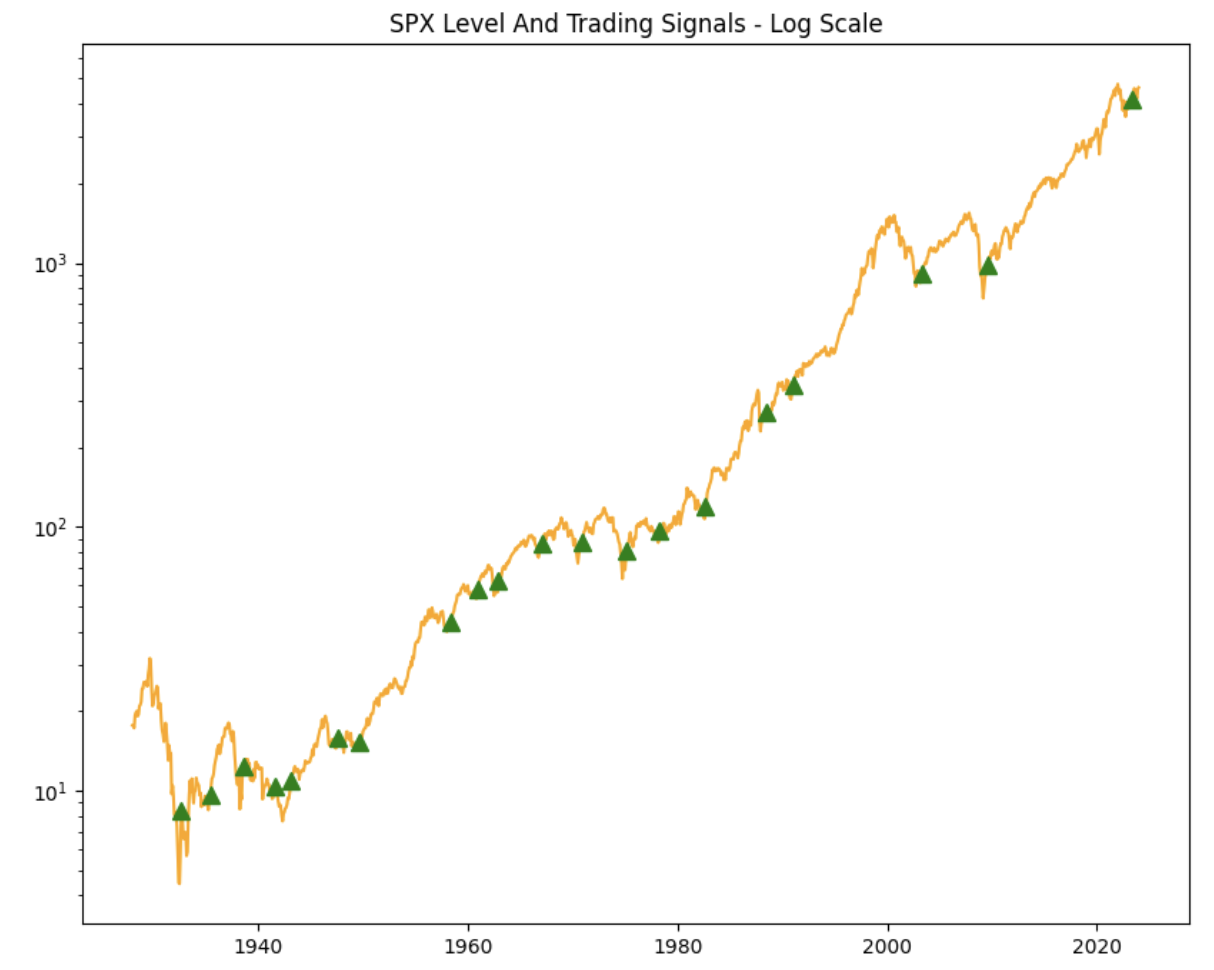
In total, the signal was triggered 25 times and the average performance was positive in all the periods tested. Here are the average returns:
- 1 month performance: 2%
- 3 month performance: 5.4%
- 6 month performance: 7%
- 9 month performance: 13%
- 12 month performance: 16.4%
And what about the Nasdaq? Here are the price levels and signals:
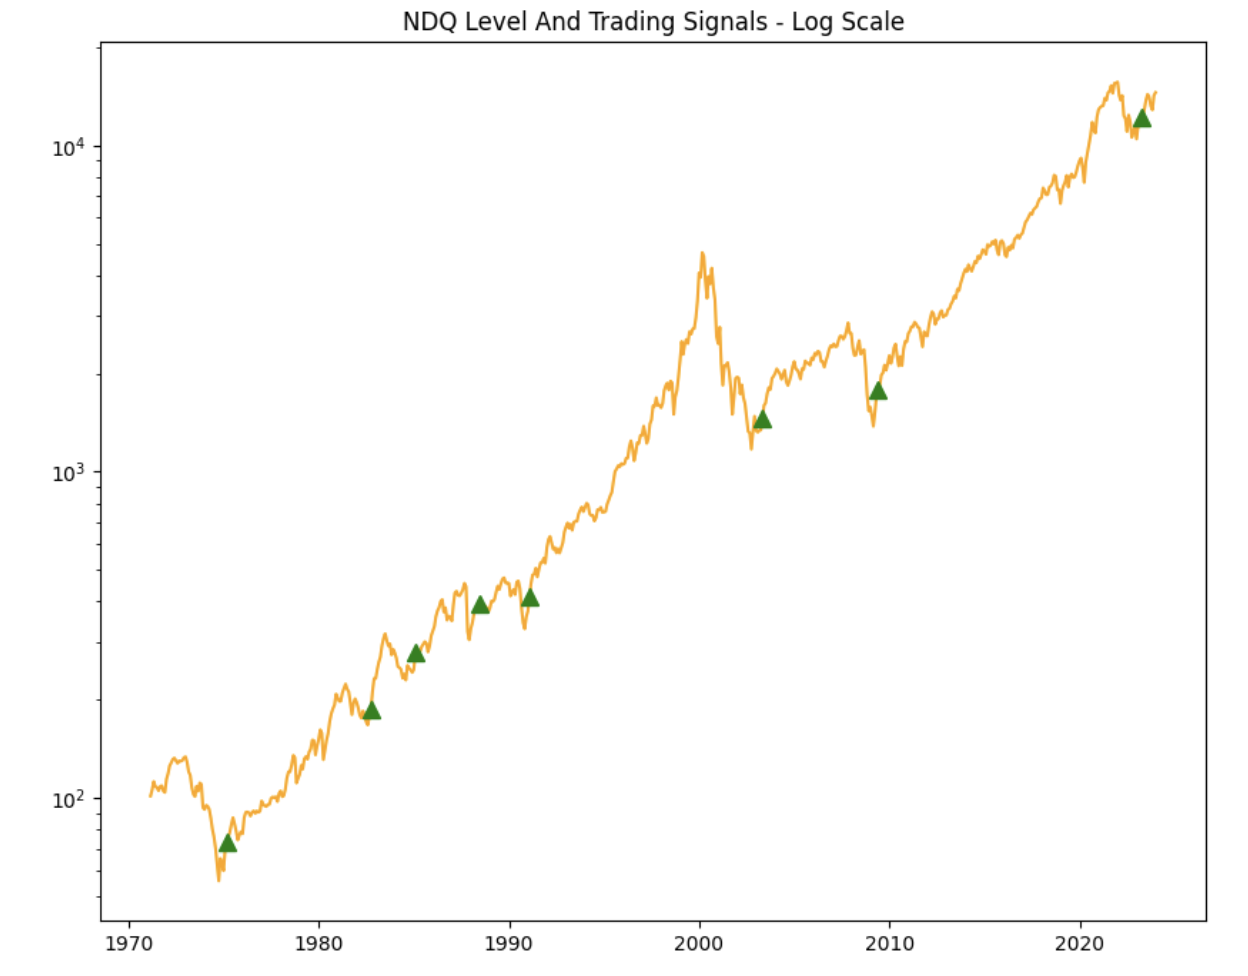
The signal was triggered 7 times and the average returns are even better than the SPX:
- 1 month performance: 5.5%
- 3 month performance: 12.2%
- 6 month performance: 18.7%
- 9 month performance: 26.3%
- 12 month performance: 31.5%
The performance for both S&P 500 and Nasdaq is a lot better than any random period. Keep in mind that dividends are not included, so the result should be adjusted up.
End of Bear Market trading strategy – conclusion
To sum up, today you learned a trading signal to get back into the market after an 18-month low. The results? Buying SPY when the signal is triggered has turned out to be very profitable, with solid average returns year after.
We remind you that we have hundreds of other trading strategies.
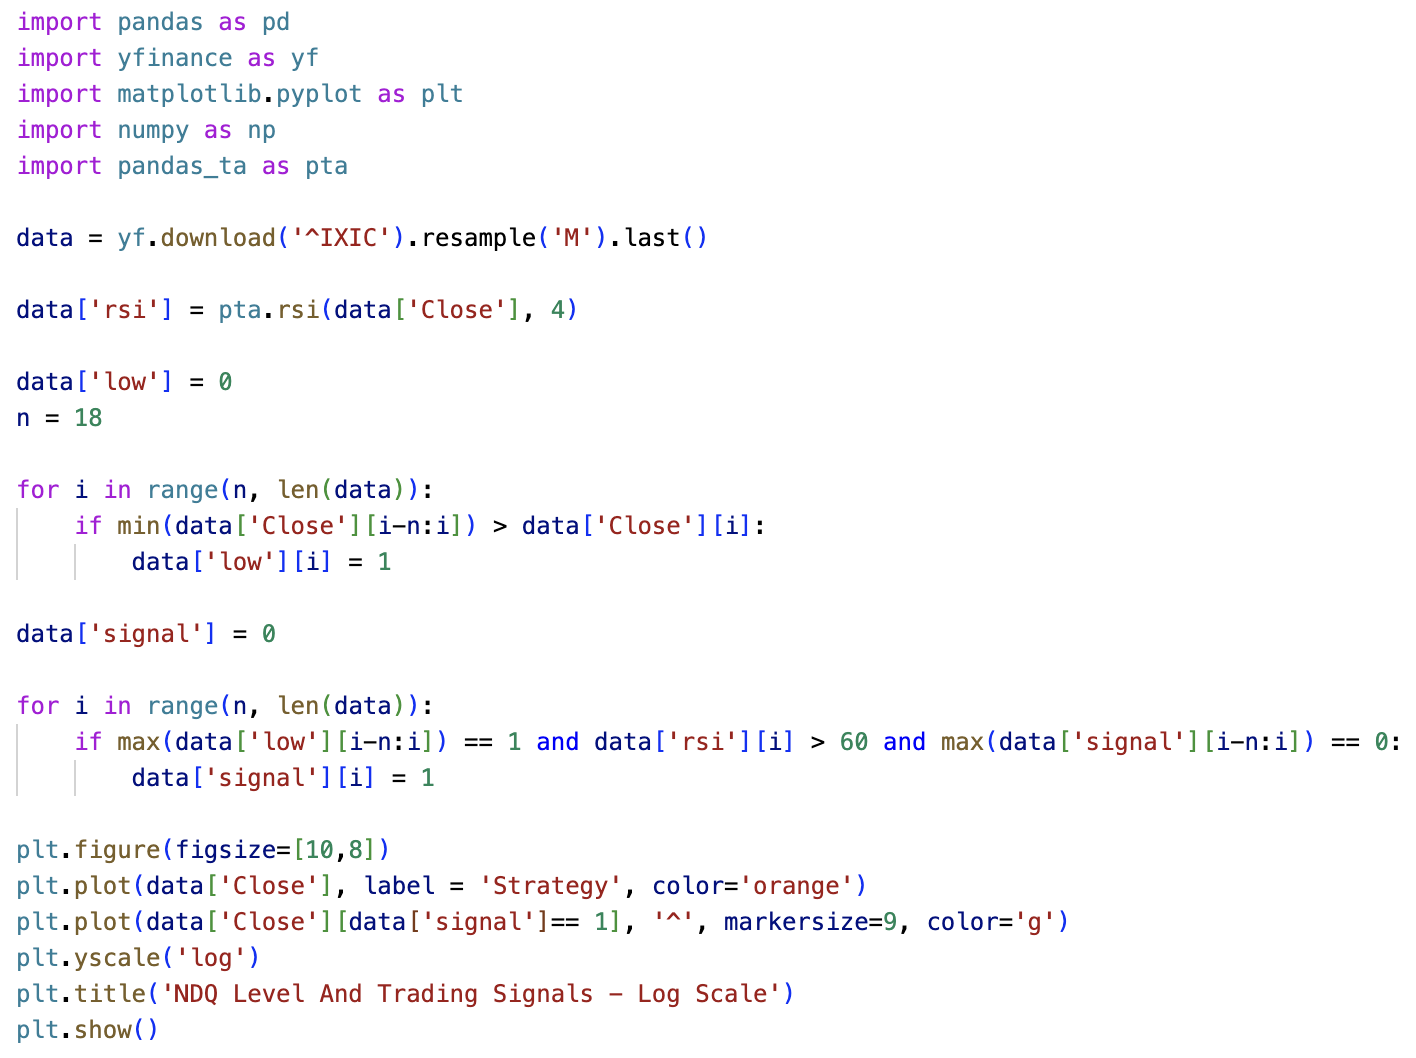
End of bear market trading strategy – Python code
The complete Python code for the strategy looks like this: