
Footprint Trading Strategy – What Is It?
Footprint trading strategy is a popular strategy used by traders to analyze and interpret order flow and volume data in financial markets. It provides valuable insights into the dynamics of buying and selling activities at each price level.
In this article, we will delve into the details of what we might call footprint trading, including the interpretation of footprint charts, identifying trading opportunities, analyzing delta footprint charts, implementing volume analysis, and tips for effective footprint trading.
What On Earth is Footprint Trading?
Footprint trading involves the analysis of order flow and volume data in real-time, displayed in a visual format known as a footprint chart.
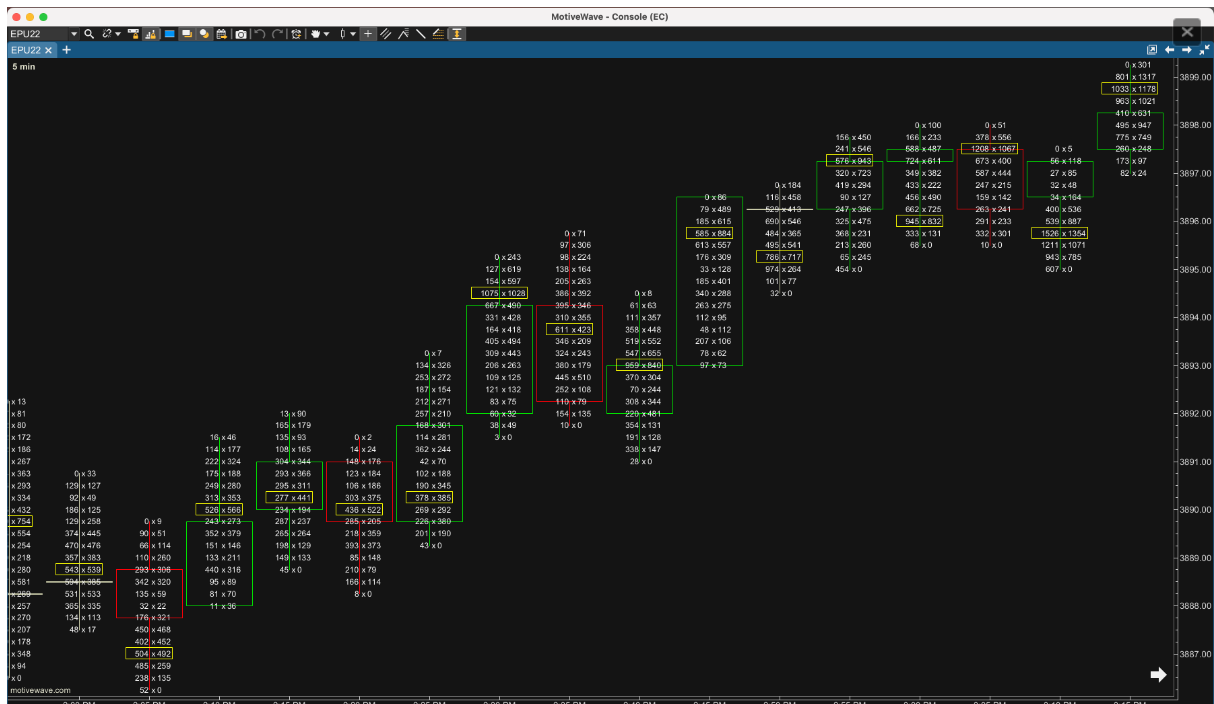
Above is an example of a footprint chart (courtesy of jumpstarttrading.com).
The footprint chart represents the buying and selling activity at each price level, providing a comprehensive view of market dynamics. Traders use footprint charts to identify trading opportunities and gauge market sentiment.
It might resemble a support and resistance trading strategy. However, it’s pretty cumbersome to backtest a footprint trading strategy because it requires a lot of trading rules.