
Fractal Indicator Trading Strategy — Backtest
The financial markets may seem to move randomly, but they actually move in repeating patterns and trends. One indicator traders use to take advantage of the patterns is the fractal indicator. What is it?
Fractal Indicator Trading Strategy is the simplest form of the repeating patterns that form in the financial markets. The fractal indicator is a simple five-bar reversal pattern that isolates potential turning points on the price chart and marks them with arrows. It helps traders determine the direction price will develop, so it may be used to identify trading opportunities or when to exit a trade.
A fractal indicator trading strategy is not easy to backtest, but at the end of the article, we present you with such a strategy.
In this post, we take a look at the fractal indicator trading strategy and how to use them.
What is the fractal indicator (trading strategy)?
Fractal is the simplest form of recurring patterns in the financial market. The fractal indicator identifies these patterns and isolates potential reversals on the price chart. It draws arrows to show the presence of these patterns.
The fractal signals can be bullish or bearish, based on the reversal it is indicating. The bullish fractal tells you that the price has the potential to move higher and is marked by an arrow below it (light-blue arrows in the chart below). On the other hand, a bearish fractal tells you that the price has the potential to slip lower and is marked by an arrow above it (the light-red arrows in the chart below).
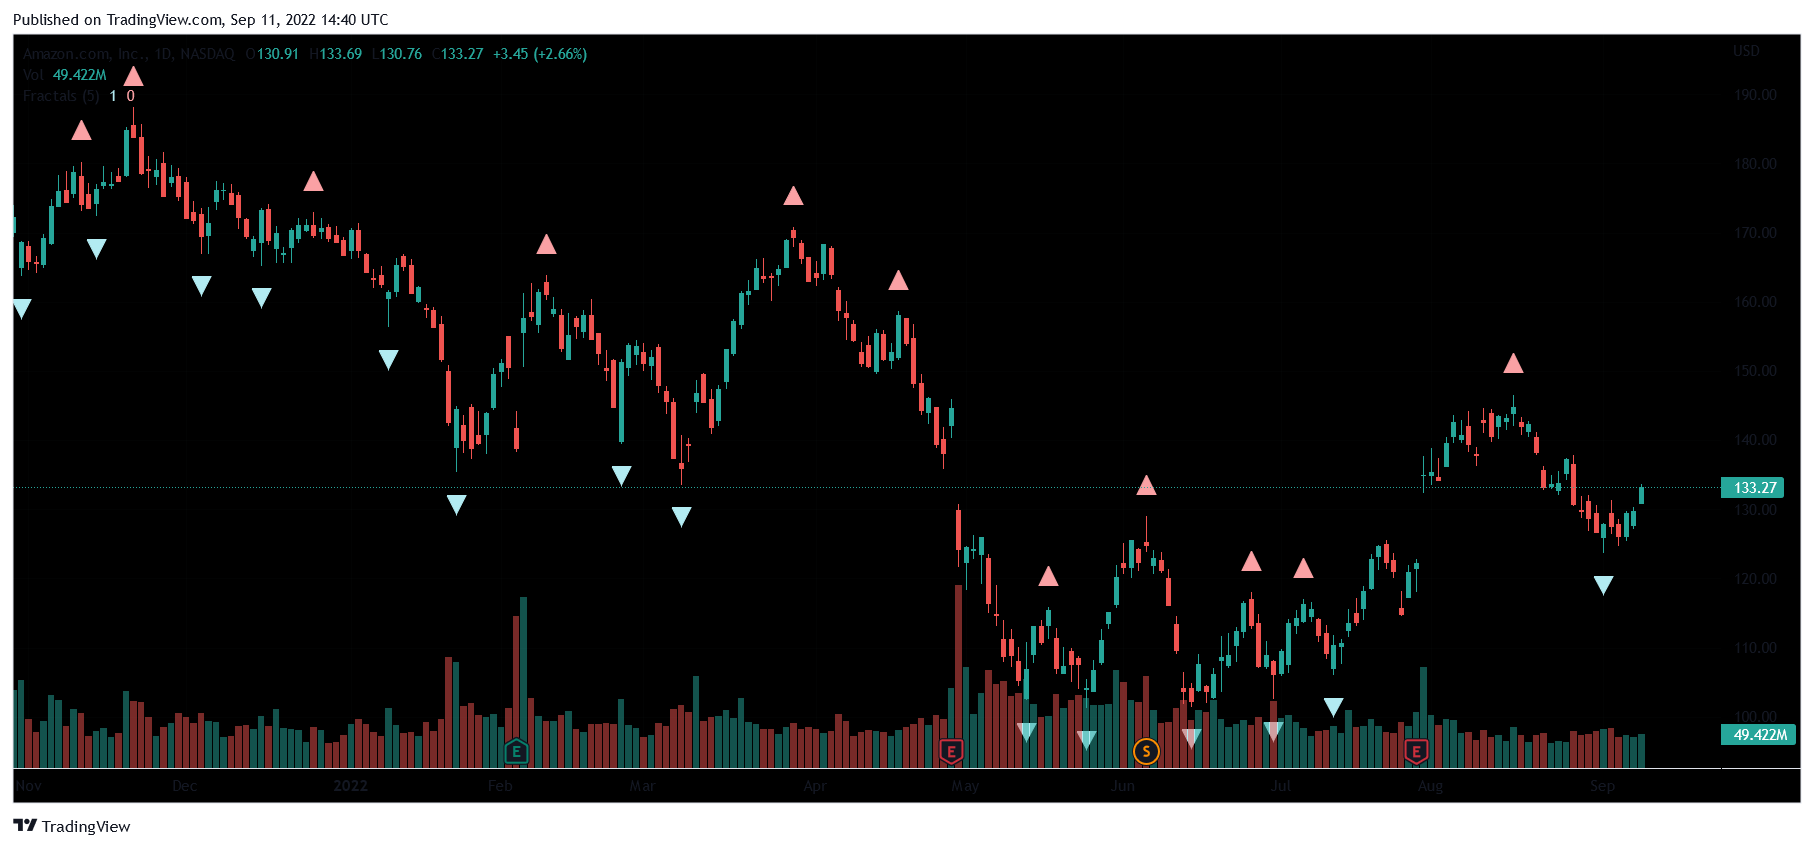
A bullish fractal is formed when there is a low bar with two higher bars on each side of it. Conversely, a bearish candle is formed when there is a high bar with two lower bars on each side of it. An up-arrow (above the price) usually indicates a bearish fractal while a down arrow (below the price) indicates a bullish fractal.
The arrows are drawn in the mid-bar (low or high bar), in as much as the pattern consists of five bars, there is no possibility that you can place a trade at the up arrow because the arrow will only be formed after the price action has made two new bars. The entry signal would usually be the opening price of the third bar after the arrow. Thus, the fractal indicator is a lagging indicator.
Fractal indicator formula
The formulas for calculating the fractal indicator are as follows:
Bullish Fractal = Low Price (n) < Low Price (n – 2) and
Low Price (n) < Low Price (n – 1) and
Low Price (n) < Low Price (n + 1) and
Low Price (n) < Low Price (n + 2),
Bearish Fractal = High Price (n) > High Price (n – 2) and
High Price (n) > High Price (n -1) and
High Price (n) > High Price (n + 1) and
High Price (n) > High Price (n + 2).
Where;
n = the high and low of the current price bar.
n – 2 = the high and low of the price bar two periods before n.
n – 1 = the high and low of the price bar two periods after n.
n + 2 = the high and low of the price bar two periods before n.
n + 1 = the high and low of the price bar two periods after n.
To identify fractals manually on the chart:
-
Isolate a high or low point on the chart.
-
If a high has lower highs to the left and right, then a pattern has been formed. The pattern needs two additional bars to the right of it as confirmation if you are using the default 5-bar setting.