
Gravestone Doji Candlestick Pattern: Backtest Results
Candlestick charts are instrumental in identifying minor fluctuations in prices and trends, which frequently result in patterns that signal potential trading opportunities. Among the various candlestick patterns, the Gravestone Doji is considered a highly reliable indicator. Are you interested in learning more about the Gravestone Doji candlestick pattern trading strategy?
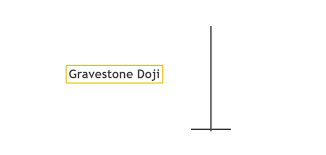
The Gravestone Doji is a bearish reversal candlestick pattern characterized by a long upper shadow, a small or nonexistent body, and a minimal or nonexistent lower shadow. It occurs when the opening, low, and closing prices are all situated close to one another. The lengthy upper shadow indicates that the bullish momentum seen at the start of the session was overtaken by bearish forces by the end of the session.
In this post, we take a look at the Gravestone Doji candlestick pattern trading strategy.
Understanding the Gravestone Doji Candlestick Pattern
The Gravestone Doji is a bearish reversal candlestick pattern characterized by a long upper shadow, a small or nonexistent body, and a minimal or nonexistent lower shadow. It occurs when the opening, low, and closing prices are all situated close to one another, creating a distinct inverted “T” shape. The lengthy upper shadow indicates that the bullish momentum seen at the start of the session was overtaken by bearish forces by the end of the session.
The pattern is widely used by traders to identify the beginning of a potential downward trend in the market. It is formed when the opening, low, and closing prices of an asset are all close to each other, resulting in a small or nonexistent real body and a long upper shadow. The pattern is usually seen at the top of an uptrend, and its appearance suggests that sellers are starting to take control and push prices lower. It is considered one of the most reliable bearish reversal patterns, and traders often use it to confirm downtrends or to enter short positions.
However, it is important to keep in mind that the Gravestone Doji is not a guarantee of a trend reversal and should be used in conjunction with other technical analysis tools and indicators to make informed trading decisions. Also, traders should consider the overall market context and analyze other relevant economic data before making a trade based on this pattern.
Gravestone Doji Candlestick Pattern Backtest
We recommend backtesting absolutely all your trading ideas – including candlestick patterns.
In order to backtest candlestick patterns you need to set specific rules and definitions. That requires both time and effort, but don’t worry: it’s already done for you!

We have defined ALL 75 candlestick patterns and put them into strict trading rules that are testable. Each single candlestick pattern is backtested and includes rules, settings, statistics, probabilities, and performance metrics.
Even better, you get the rules with Amibroker or Tradestation/Easy Language code (in addition to plain English if you like to code yourself, like putting it into a Python trading strategy, for example).
Click here to read more or order.
Identifying the Gravestone Doji in Trading Charts
Identifying the Gravestone Doji candlestick pattern in trading charts is a crucial skill for traders who use price action analysis as part of their trading strategy. The Gravestone Doji is a single candlestick pattern that is formed when the opening, low, and closing prices of an asset are all close to each other, resulting in a small or nonexistent real body and a long upper shadow.
To identify the Gravestone Doji, you should look for the following key characteristics:
- Small or nonexistent real body: The real body, which represents the difference between the opening and closing prices, should be small or nonexistent.
- Long upper shadow: The upper shadow, which represents the highest price reached during the trading session, should be significantly longer than the real body. It should be about 2-5 times the size of the real body.
- Little or no lower shadow: The lower shadow, which represents the lowest price reached during the trading session, should be small or nonexistent.
- Appearance at the top of an uptrend: The Gravestone Doji is most commonly seen at the top of an uptrend, signaling a potential trend reversal.
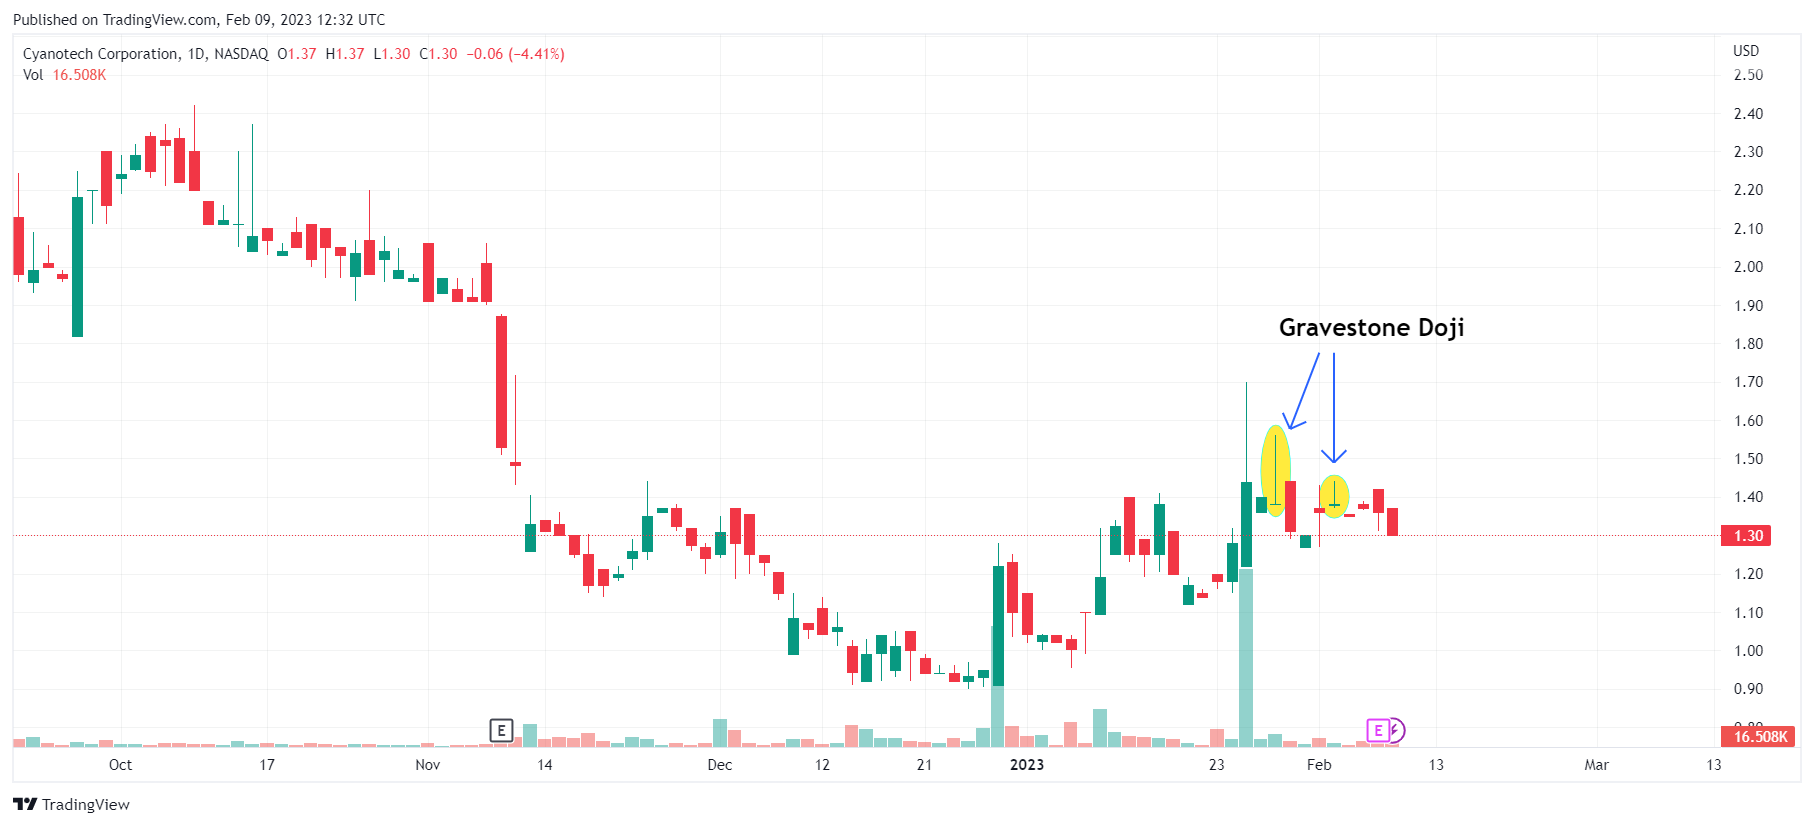
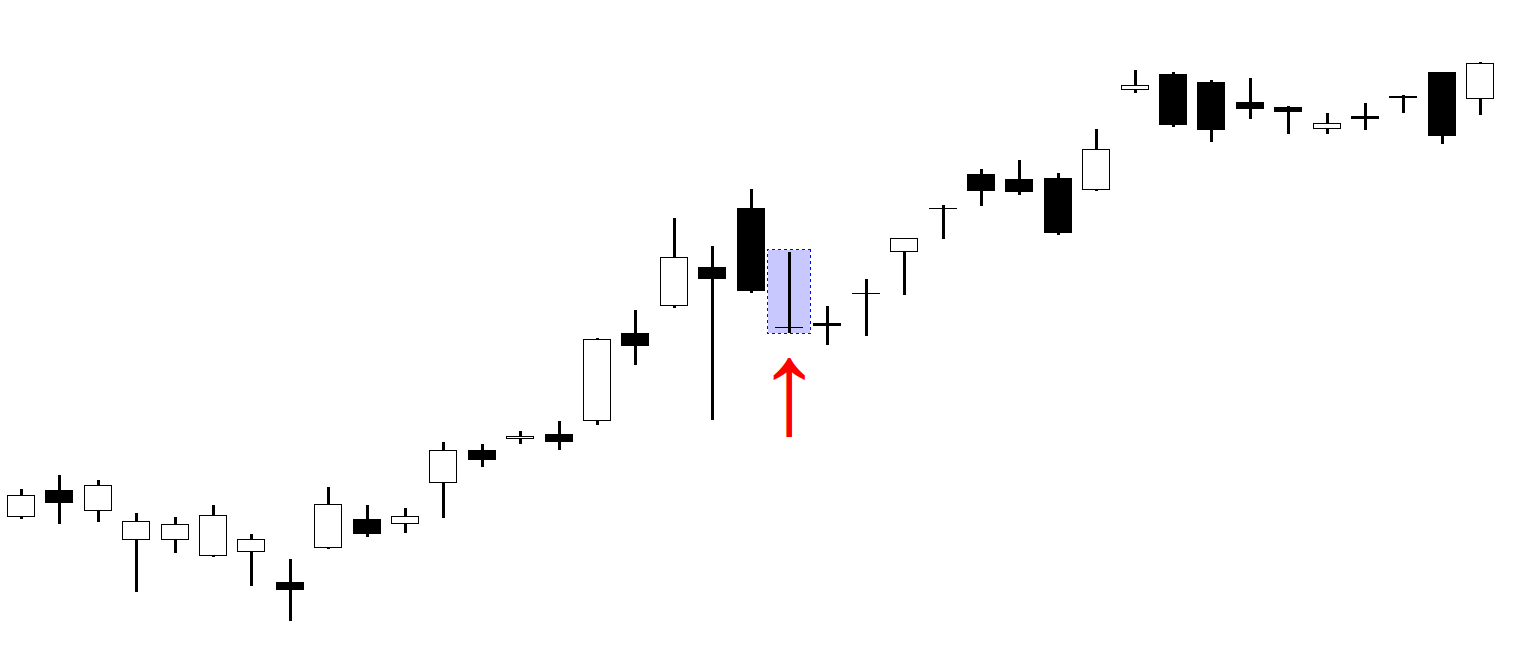
It’s important to note that the Gravestone Doji is n