
Harmonic Bat Pattern Trading Strategy: Backtest And Examples
There are different types of the harmonic chart pattern. The Bat pattern is one of the many harmonic patterns named after animals, but what is it?
The Bat pattern is a simple XABCD harmonic pattern that consists of four price swings and five pivot points — X, A, B, C, and D. One of the harmonic patterns was developed by Scott M Carney – it is believed to have a good reward ratio. With the harmonic chart pattern, you may be able to predict how the price might move in the near future.
In this post, we take a look at the Bat harmonic pattern and make a backtest at the end of the article.
What is a harmonic Bat pattern strategy?
The Bat pattern is a simple XABCD harmonic pattern that consists of four price swings and five pivot points — X, A, B, C, and D. One of the harmonic patterns developed by Scott M Carney, the pattern consists of the XA, AB, BC, and CD price swings.
As with other XABCD harmonic patterns, the Bat pattern starts from point X and swings through points A, B, and C, eventually ending at point D, making two impulse waves and two correction waves. The XA and CD swings are the impulse waves, whereas the AB and BC swings are correction waves.
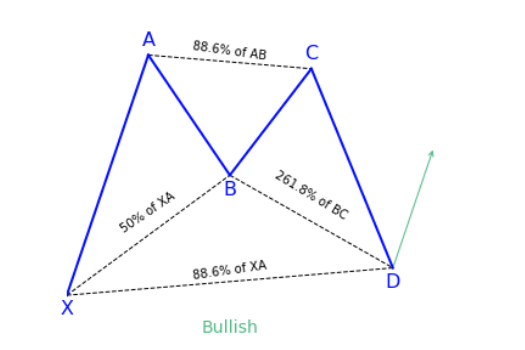
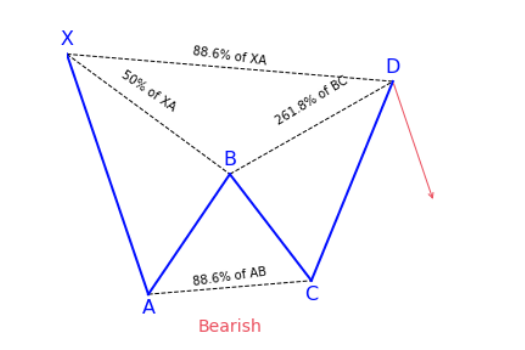
As you can see, the AB swing is a retracement of the XA swing, while the BC swing is a retracement of the AB move. Then comes the CD swing, which extends beyond the B point but doesn’t get to the X point. In a way, the pattern looks like the Gartley pattern — the only difference is in the Fibonacci ratios. As with other harmonic patterns, the Bat pattern can have a bullish or bearish orientation. See the illustration of the bearish pattern below:
What are harmonic patterns?
Harmonic patterns are chart formations that arise from a unique pattern of price waves. They typically consist of four price waves with five swing points that follow unique Fibonacci ratios. The harmonic patterns are considered reversal patterns that may either indicate a trend reversal or the reversal of a multi-legged pullback.
By identifying and analyzing harmonic chart patterns, you can predict how the price might move in the near future. But to exploit the trading opportunities that come with the patterns, you must first know the criteria for identifying a valid pattern.
Harmonic Bat pattern trading rules
The criteria for identifying the Bat pattern are as follows:
- The XA wave is a normal price swing in the upward or downward direction.
- The AB wave is a 38.2% or 50.0% retracement of the XA wave.
- The BC wave can be either a 38.2% or 88.6% retracement of the AB wave.
- If the BC correction wave is 38.2% of the AB swing, the CD wave should be a 161.8% extension of the BC wave. But if the BC wave is 88.6% of the AB wave, then, the CD wave must be around a 261.8% extension of the BC wave.
- Overall, the CD wave should be 88.6% retracement of the XA move.