
Heikin Ashi Candlesticks Trading Strategy (Backtest And Performance Analysis)
A reader recently asked if we use Heikin Ashi Candlestick in our trading. So what exactly is Heikin Ashi? In this article, we will reconsider the price representation called Heikin-Ashi, and try to get something good out of the charting technique to use it for algorithmic trading. Can we make a Heikin Ashi trading strategy?
Yes, we show you a profitable Heikin Ashi trading strategy. Moreover, we test some additional filters to improve Heikin Ashi so we can use it as a stand-alone Heikin Ashi trading strategy.
The Heikin-Ashi method was imported into the West from Japan in the second half of the 90s and is a representation of prices aimed at highlighting the presence of trends or phases of consolidation. Thus, in short, Heikin Ashi is another version of Japanese candlesticks. Let’s dig a bit further into the charting method.
What is Heikin Ashi Candlestick?
The name implies it originates from Japan. As it turns out, Heikin Ashi candlesticks are another version of the famous Japanese candlesticks used in all our charting. Presumably, Heikin Ashi means “average bar” in Japanese, which sums up the difference between the two forms of candlesticks.
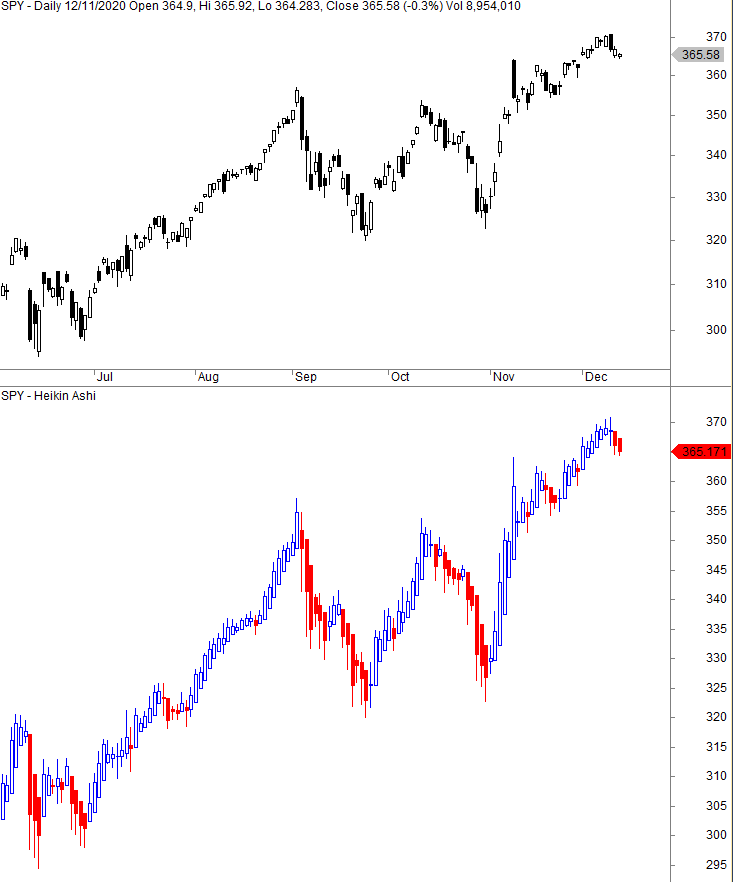
Candlesticks show the daily price action of the open, high, low, and close, while Heikin Ashi aims to indicate the trend by smoothing the price movements. Heikin Ashi is, to our understanding, used mainly as a supplement for other indicators, something we will test further down in the article.
Western trading owes much to Japanese trading. For example, the candlestick price representation is Japanese, imported to the West around the 1980s. Since the second half of the 1990s, a new “candlestick” representation was imported from Japan to the West, largely thanks to an article written by trader Dan Valcu in 2004. This price representation is called Heikin-Ashi, which means Average-Bar.
Heikin Ashi candlesticks aims to eliminate the “noise” in the prices to bring out the directional component or the consolidation phases. The Heikin-Ashi method has obtained tremendous popularity on the web, but if it is not understood thoroughly, it can lead to trading mistakes.
First, the Heikin-Ashi do not show the real prices, so it is impossible to trade directly on them. The four prices that characterize the candle are not real prices. Something similar also happens with other charting techniques, such as the one called Range Bar and the one called Renko, which you can learn more about in these articles:
To understand the difference, we need to look at how it’s calculated:
How to calculate Heikin Ashi
The formula is not straightforward and is a bit complicated.
Heikin Ashi smooths the candlesticks using average open, high, low, and close values. However, the open and close are calculated differently for Heikin Ashi – it’s not the actual prints, but a mathematical formula is used to make “artificial” values.
As mentioned, the popularity of the Hekin-Ashi method in the West is largely due to trader Dan Valcu who described it in 2004 in an article that appeared in the famous Stocks & Commodities magazine. In this article, he wrote that the Heikin-Ashi values are calculated as follows:
- haClose = (O+H+L+C)/4;
- haOpen = ema(Ref(haClose, -1), 3);
- haHigh = Max(H, haOpen);
- haLow = Min(L,