
How To Build A Profitable ROC-Based Trading Strategy Using Python
Introduction
This tutorial will implement a ROC trading strategy using Python. The first part will briefly explain the indicator and its calculation. The second part will calculate the Python example. We show you how to build a profitable ROC-based trading strategy using Python. However, the main purpose of the article to show how it can be done using Python. The strategy itself is of minor importance in this tutorial.
Indicator
The Rate of Change (ROC) measures the momentum of price movement between two periods of time. This indicator identifies the securities that outperform or underperform the market. When companies have solid financial situations, the expectation is steady growth in their stock price; the ROC will pick up some of these companies because they have positive returns. It can be used for sideways markets to find overbought or oversold securities.
The formula is:
\text{ROC} = \frac{\text{Price} - \text{Price}_n}{\text{Price}_n}Price=current preriod
Pricen = Price n periods back.
ROC = Rate of Change
Download Data and Indicator
This article will use the Invesco QQQ Trust Series 1 (QQQ) ETF. As in the previous tutorial, the first step is to import the libraries and download the historical data:
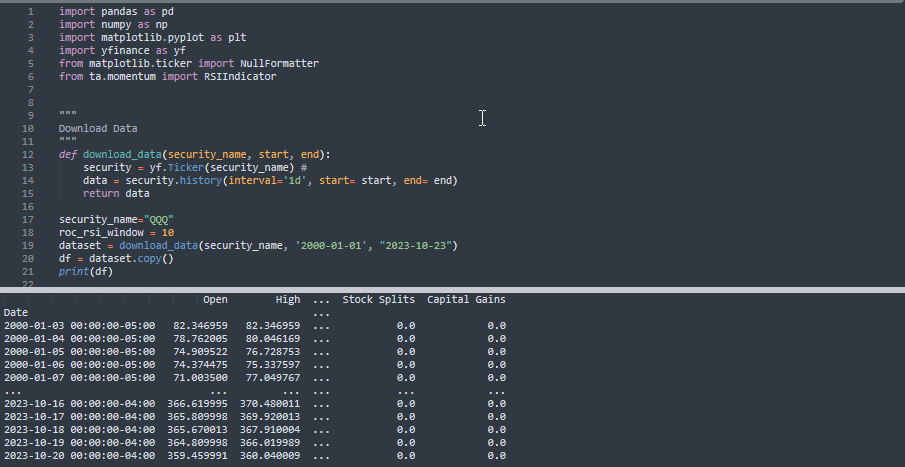
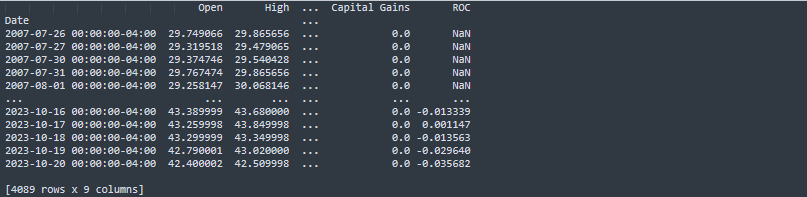
The following image illustrates the rate_of_change function, which calculates the Rate of Change (ROC). The panda’s method .pct_change(period=n) calculates the ROC between the current value and the value from 15 periods back. When n=15 means the percentual variation between the period analyzed and 15 days back.

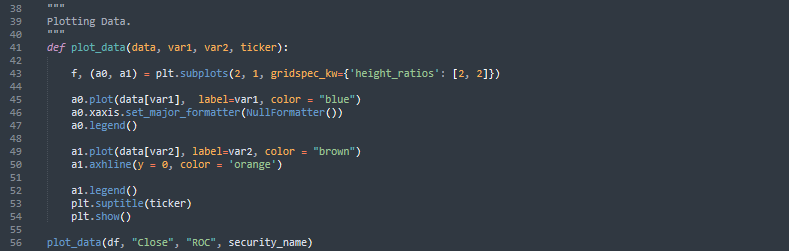
To plot the closing price and the ROC in the same chart is necessary to implement the plot_data function. This function has two charts, at the top, the closing price, and at the button, the indicator.
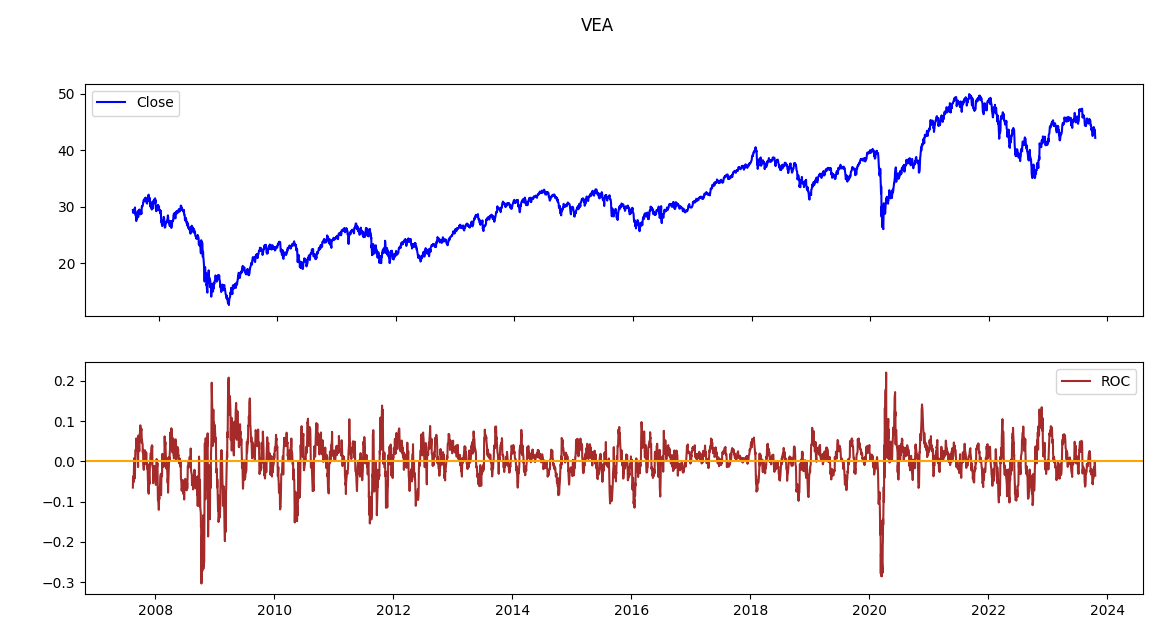
In the previous chart, the closing price tends to increase over time. The total return in 15 years is around 50%. Although it does not behave sideways, a mean reversion strategy can be implemented with minor modifications.
The following function estimates the RSI with the values from the Rate of Change. The rsi_function function uses the RSIIndicator class from the ta Python library to calculate the RSI. It has 14 periods (window=14) as a default look-back window.

The following image shows the rsi_function function implementation:

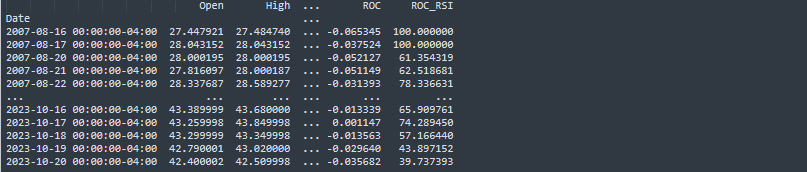
After adding some modifications to the plot_data function, the following image shows the plot_data1 function. It plots at the top the closing price and the RSI below with 30% and 70% bands.