How to Exploit the End of Month Bias in Stocks: Trading Strategies
The end-of-month bias (effect) in stocks is well documented. But how strong is the bias? We conduct a simple test to show how strong the effect is.
The return in the S&P 500 at the end of the month is so strong that it explains almost the majority of the gains over the last 22 years.
The chart below shows the performance if you buy at the close of calendar day N and sell 5 days later:
[am4show have=’p2;p3;p58;p59;p130;p138;’ user_error=’Premium Post Access’ guest_error=’Premium Posts’]
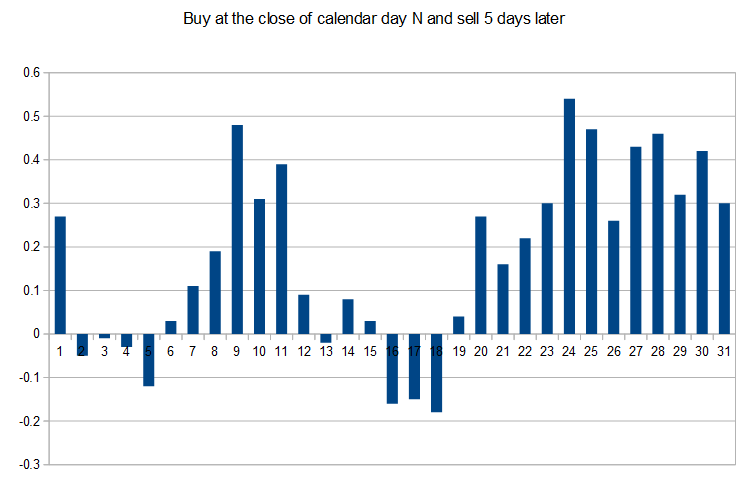
The test period is from January 2000 until today. The left axis shows the average gain in % per trade. The best day is the 24th which has an average gain of 0.53% over the next five days (if you bought the close on the 24th). This is obviously much better than any random day.
[/am4show]
With such a strong bias it’s possible to build strong trading strategies.
The question is: Will this bias continue working?
That’s of course impossible to tell, but we believe there are good reasons to believe so. Capital flows to stocks predominantly at the end of the month, and as long as this continues we see no reason why it will stop.
Another reason might be the lack of macro numbers. They are mostly published at the beginning of the month, not the end.
FAQ:
What is the end-of-month bias in stocks?
The end-of-month bias refers to a well-documented phenomenon where stock prices tend to exhibit a specific pattern or trend towards the end of each month. This bias is often characterized by a notable increase in the S&P 500 returns during this period.
How strong is the end-of-month bias in stocks?
The end-of-month bias is quite robust, as evidenced by a simple test conducted over the last 22 years. The return in the S&P 500 at the end of the month explains a significant portion of the overall gains during this period. The chart illustrates the performance of buying at the close of calendar day N and selling five days later. It shows the average gain in percentage per trade during the test period from January 2000 until today.
Which day exhibits the highest average gain in the chart?
The 24th day stands out with the highest average gain of 0.53% over the next five days. This suggests that buying at the close on the 24th historically yields better results than choosing a random day. The historical data indicates a consistent pattern, making it a potential foundation for effective trading approaches.