
In Sample Vs. Out Of Sample Testing
An underrated part of trading is out-of-sample testing. In this article, we explain what out-of-sample trading tests are and look into why this is important and how you should test out-of-sample in your backtesting.
In sample vs. out of sample means dividing your historical data into two parts: one part where you make the rules and parameters (in sample), and one part where you test the in sample rules on unknown data (out of sample).
Finally, before putting real money to the test, you test the trading strategy live in a demo account (incubation – see next lesson).
What is an in-sample test?
An in-sample test is simply the testing you do on your available data. It’s the data you use to confirm or falsify your hypothesis.
Many traders like to split their dataset into two parts: one part to test in-sample and one part to test out-of-sample. You compare the in-sample data vs the out-of-sample data:
What is an out-of-sample test?
When you have tested a trading idea and formed a conclusion you need to test your trading strategy on unknown data.
Let’s say you have data from 2005 until 2021. A practical way of testing is by splitting the dataset into two parts, for example, the in-sample test from 2005 until 2017, and then the out-of-sample backtest from 2018 until 2021.
Basically, you make your strategy on the data until 2018 and base your conclusion on that time period.
When you have made a strategy on the data up to the end of 2017 you test the strategy on the “unknown” data from 2018 to 2021. If the strategy performs well on the “unknown” data, you might have a very good strategy. Then you can go on to the incubation period (see the next lesson).
Doing it this way, you do two tests: in-sample and out-of-sample.
A practical example of in-sample and out-of-sample test (in sample vs. out-of-sample)
Here is a practical example of an in-sample and out-of-sample test:
We consider the ETF XLP as one of the best trading vehicles around, and below is a short-only backtest.
The strategy has currently two parameters as a short signal, and the in-sample period from 1993 until the end of 2017 looks like this:
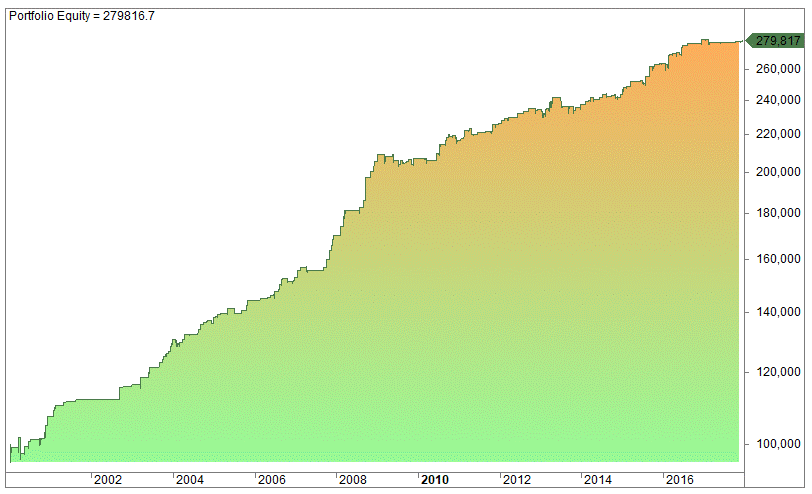
The in-sample test showed 264 trades, 0.4% average gain per trade, CAGR was 5.88%, time spent in the market was 8%, and the profit factor was 3.33.
Let’s go on to backtest out-of-sample from 2018 and onwards:
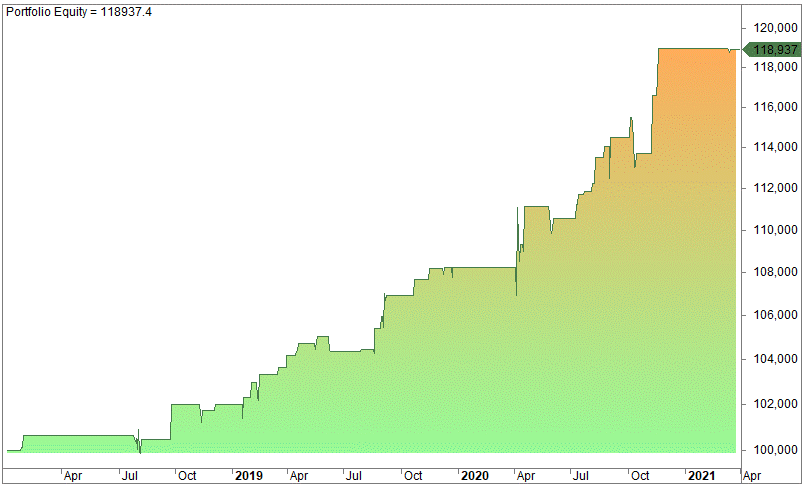 From 2018 until May 2021 it has generated 43 trades, the average gain is 0.41%, time spent in the market is 7.7%, the CAGR is 5.5%, and the profit factor is 4.98. We believe the result is pretty good for a short strategy!
In other words, the out-of-sample backtest has performed more or less exactly as the in-sample test.
However, we like to do some trades in the demo account to see how it performs in live trading before we commit money, and also how it performs together with the other strategies in XLP and other equity ETFs/futures. This is the incubation (see next lesson).
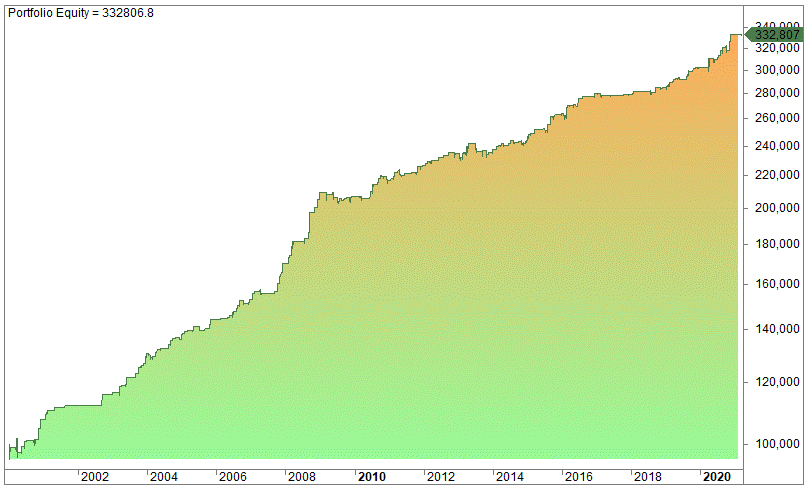
Over the whole period the equity curve looks like this:
Walk forward optimization:
In order to make a better test that can stand the test of time, many traders like to use what is called walk forward optimization. Yes, the word optimization is correct: Walk forward is a kind of optimization by using in-sample and out-of-sample tests frequently.
It’s done like this:
Let’s assume you have 20 years of data. You can divide the data into 10 equal parts, ie two years. Those two years are then divided into two parts: the first year is for in-sample and the second is for out-of-sample. You make the best parameters in year one, and test this out-of-sample in year two.
This is repeated ten times and the final results are evaluated to make the final parameters for the strategy.
Is this a good way of making strategies? We have tried it but we stopped for a number of reasons, the main reason being we didn’t find any improvement in our trading by doing it this way.