
MACD and RSI Trading Strategy: Rules, Setup, Backtest – Achieving an 80% Win Rate
There are different ways of performing technical analysis. While some focus on price action, others make use of indicators. Both moving average convergence divergence (MACD) and the relative strength index (RSI) rank among the most popular indicators used in technical analysis and trading. But what is the MACD and RSI strategy?
The MACD and RSI strategy refers to a trading method that makes use of both indicators in analyzing and trading the markets. The combination of both momentum indicators may give more insight into what the market may do next and how it could move in the future.
The MACD indicator is a moving average-based momentum oscillator primarily used to analyze trends, while the RSI is a momentum indicator primarily used to identify overbought/oversold conditions in the market.
In this post, we take a look at the MACD and RSI strategy and we end the article with a backtest that combines both indicators.
Related reading: 200+ Profitable and robust trading strategies
MACD and RSI strategy backtest and performance
Let’s set up a specific MACD and RSI strategy with trading rules so we can backtest it.
We incorporate both the MACD and RSI indicators, and we also use a third indicator as a mean reversion filter. When all three conditions are met, we buy, and we sell when the mean reversion filter reverses (i.e. opposite from the buy criterium).
This is it. It’s not very complicated, but it works well.
You can buy the strategy here.
The strategy works best on stocks in a specific sector. This is what the strategy’s equity curve looks like on an ETF:
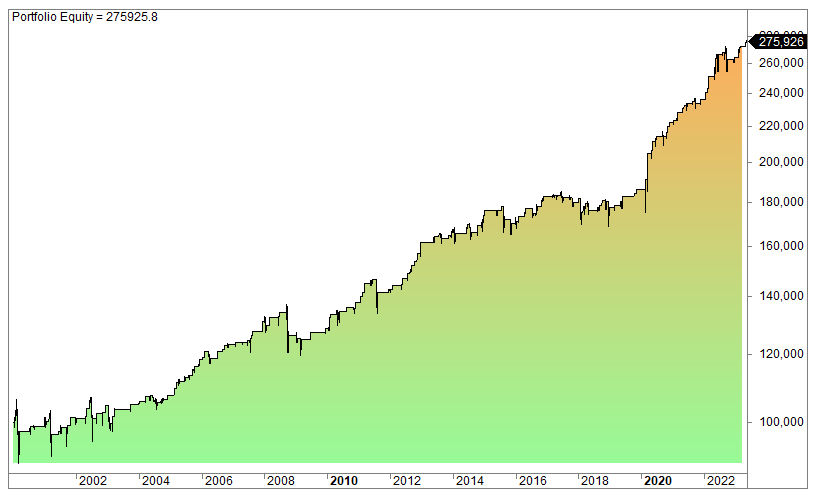
There are 169 trades, and the average gain per trade is 0.62%. Most years show positive returns, while the negative ones show small losses. The worst year was 2008, with a modest 3.6% loss (compared to 55% for S&P 500).
What is MACD?
MACD (or MAC-D, as it’s often called by its lovers) is the short form for Moving Average Convergence/Divergence. It is a momentum indicator that is mostly used to trade trends.
It is based on two exponential moving averages (EMAs) — a 26-period EMA and a 12-period EMA.
On the chart’s indicator window, it appears as two lines — the MACD line and the signal line — that fluctuate up and down about the centerline (zero line) without any upper or lower limit.
The indicator is actually an oscillator, as it oscillates above and below the zero line. But despite being an oscillator, it is not commonly used to determine overbought or oversold conditions.
Here’s a MACD video that explains the indicator in addition to having 4 specific MACD strategies: