
MACD Histogram Trading Strategy in 2024 (Rules, Setup, Backtest, Example)
Let’s test a MACD-histogram trading strategy.
This article looks at the MACD-histogram. For a primer on this indicator please read this article:
I’m trading some strategies based on mean reversion on a sample of 77 ETFs. Those ETFs are the most liquid ones. One of the strategies I trade is based on MACD-Histogram.
It’s a popular indicator I have tweaked a little bit. On a per trade basis, this is one of the best strategies I have. I have tweaked this one a little bit to the following:
MACD histogram trading strategy (Trading Rules)
We describe the trading rules both in plain English and by using a chart:
Trading Rules
[am4show have=’p2;p3;p58;p59;p130;p138;’ user_error=’Premium Post Access’ guest_error=’Premium Posts’]
- The MACD Histogram bar must have fallen 4 days in a row.
- The fourth latest bar must have been below zero.
- The current close of the ETF must be lower than the day before.
[/am4show]
Entry is on the close. The exit is on the first day when the close is higher than the day before. Here is an example (exit was on the close the day after because the ETF rose in price):
[/thrive_lead_lock]
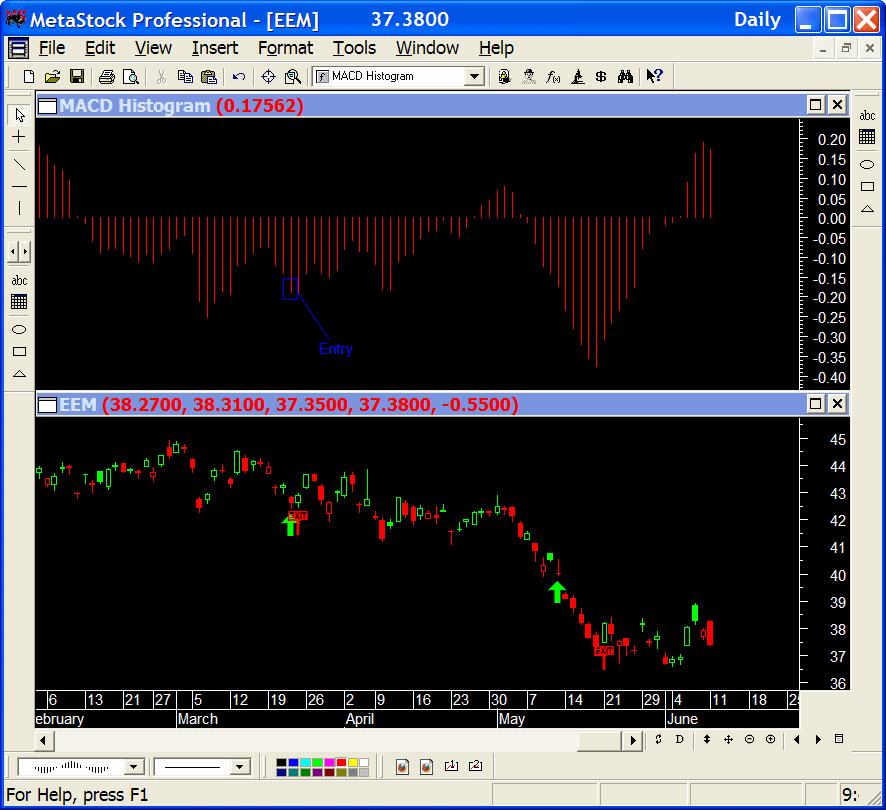
For short it is vice versa. However, long is a lot better than short. In general, short is a lot more difficult to trade.
In total, this strategy has generated 6669 trades on my portfolio of 77 ETFs.
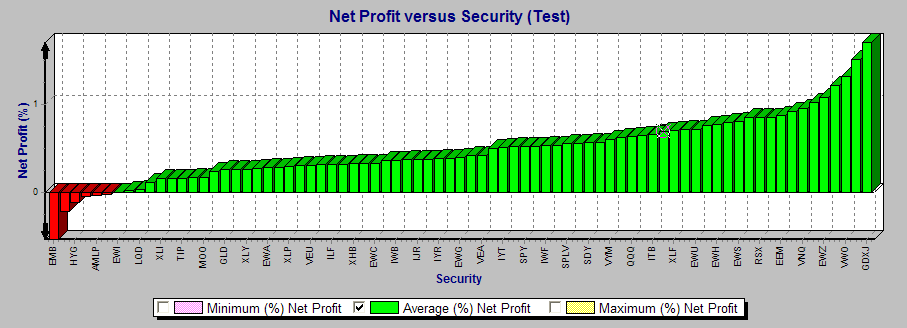
This diagram shows the average gain per trade since 2000. Among those 77 ETFs hardly any is negative:
From month to month we get the following bar chart:
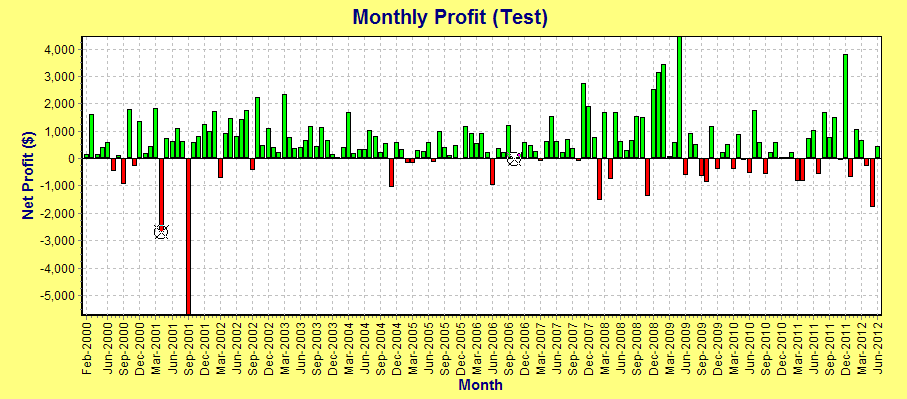
I think this is a pretty good result. Assuming one can only trade a maximum of ten positions at a time as a portfolio, we get this equity curve: