Mass Index Trading Strategy – Backtest and Example
For many traders, a market with high volatility means more room for profit. There are many tools for tracking the volatility in the market, and the mass index is one of them. What is this mass index trading strategy?
The mass index trading strategy is a popular volatility indicator that measures the range between high and low stock prices (volatility) over a specified period of time. It is used to evaluate the strength of a trend and also when a reversal is about to take place.
In this post, we take a look at the mass index strategy, and we make a backtest of the strategy.
What is the mass index?
The mass index is a popular volatility indicator that measures the range between high and low stock prices (volatility) over a specified period of time. It is used to evaluate the strength of a trend and also when a reversal is about to take place.
Introduced in the early 1990s, the indicator analyzes the narrowing and widening of trading ranges to identify potential reversals based on market patterns that aren’t often visible to other price and volume indicators.
When plotted on the chart, the mass index appears as a line that looks similar to the Accumulation/Distribution indicator or the Relative Strength Index (RSI), but it acts like the ADX in that it does not show the direction of its signal. Given that the indicator does not provide insight into the direction of the reversals, analysts combine it with directional indicators, such as the RSI.
Mass index indicator example
To help make sense of all that was explained in the previous section, let us take a look at the mass index indicator on a real chart.
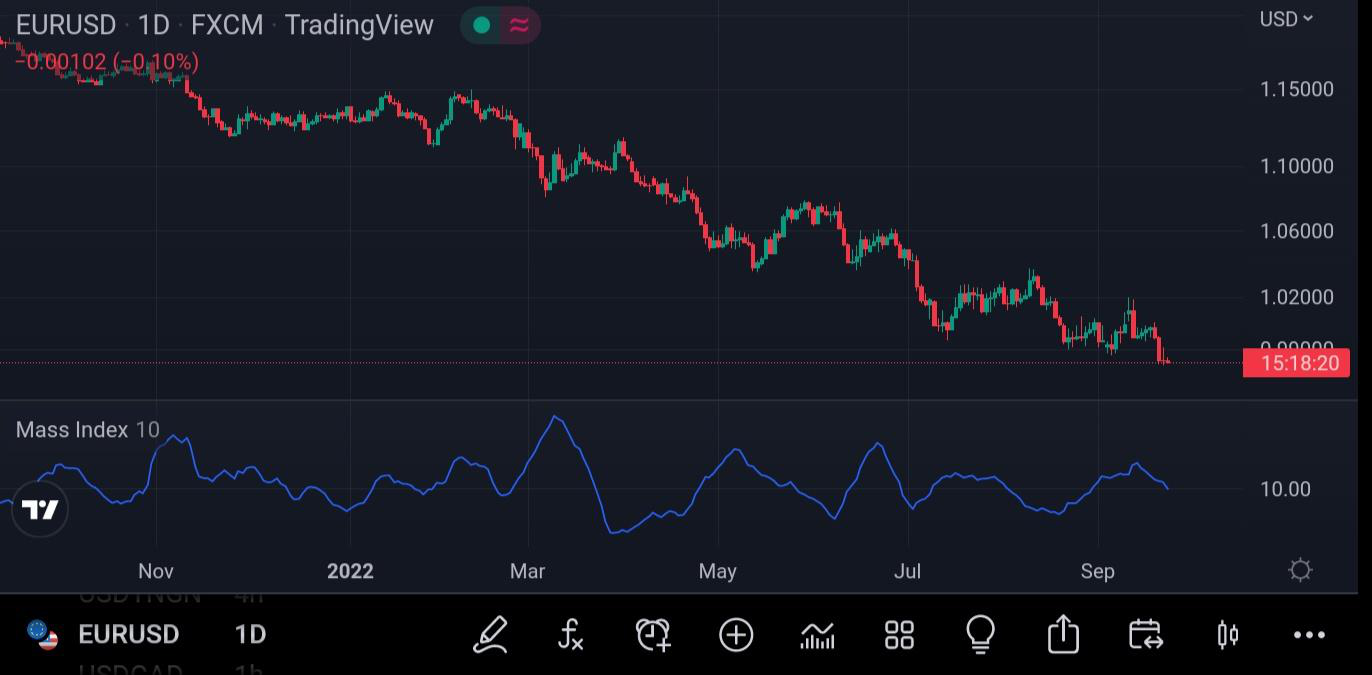
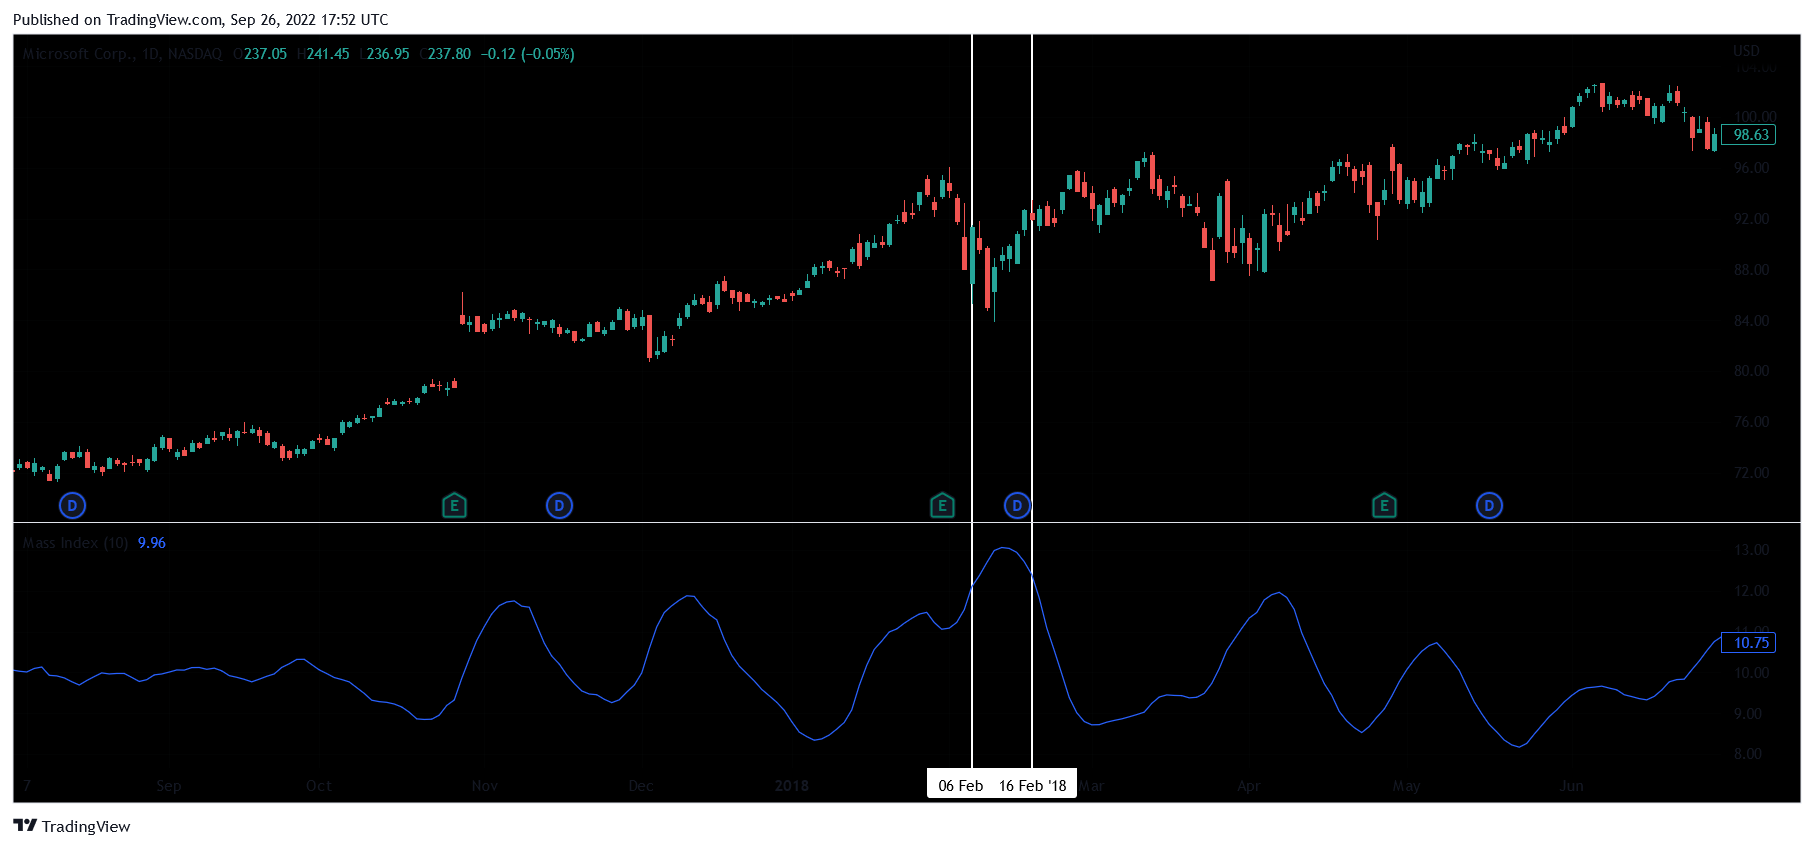
See the mass index in the indicator window of the chart above. The default setting for the index is 10 though you can tweak the period to align with your trading strategy. Although the mass index looks similar to the RSI and other momentum indicators, the interpretation is quite different. According to Donald Dorsey, the two most important numbers are 27 and 26.5 when reading the mass index. He noted that a trend reversal will most times occur when the index rises above 27 and then moves below 26.5; he termed this phenomenon a reverse bulge.
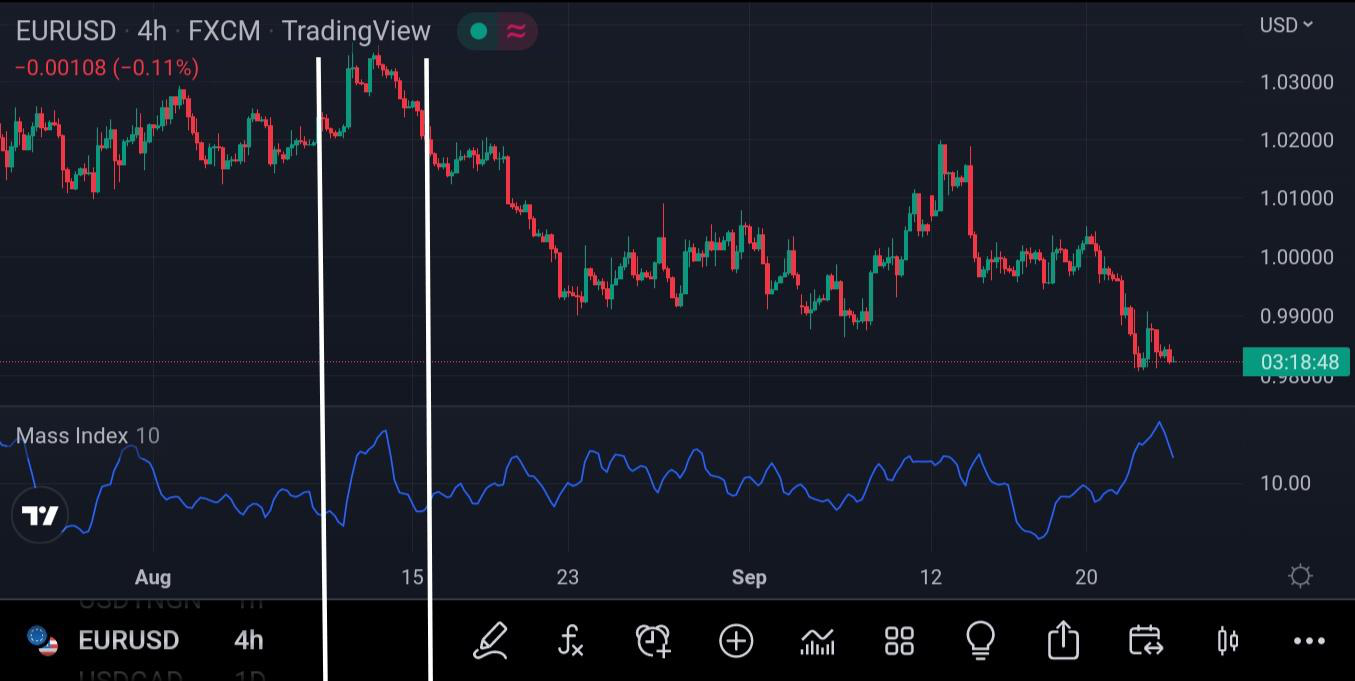
However, modified versions of the indicator available in trading platforms, such as the TradingView does not have values in the 20s range. A reverse bulge might be said to occur even at 11. See an example in the charts below: