Nasdaq100 and Bonds: A Positive correlation?
For those who follow social media, you might be aware of the following ratio that has been much discussed lately:
Nasdaq100 and Bonds.
QQQ/TLT
This is the ticker code of the ETFs of Nasdaq 100 (QQQ) and 20(+)-year Treasury Bonds (TLT).
The reason for the interest in the ratio is the divergence between the two ETFs.
Normally, interest rates have a huge impact on stocks: rising rates are bad. We have previously written about this in our article called what happens to stocks when bonds go down.
Over the last days and weeks, we have been witnessing a divergence: stocks have gone up while interest rates have been sideways or up. (Remember, if a bond falls in value it means the interest rates are going up while rising bond prices mean lower rates).
Let’s go to backtest the following strategy to see if there is any value in the QQQ/TLT ratio:
[am4show have=’p2;p3;p58;p59;p130;p138;’ user_error=’Premium Post Access’ guest_error=’Premium Posts’]
- We make a “spread” of QQQ and TLT. This is simply the price of QQQ divided by TLT.
- We make a 5-day RSI of the spread in number 1.
- When the value in number 2 is below 25, we go long QQQ and short TLT. We cover when the RSI rises above 50.
- When the value in number 2 is over 75, we go short QQQ and long TLT. We cover when the RSI drops above 50.
- All buying and selling are done at the close.
- We allocate 60% to QQQ and 40% to TLT (QQQ is more volatile).
[/am4show]
Let’s look at how our strategy has performed since 2003:
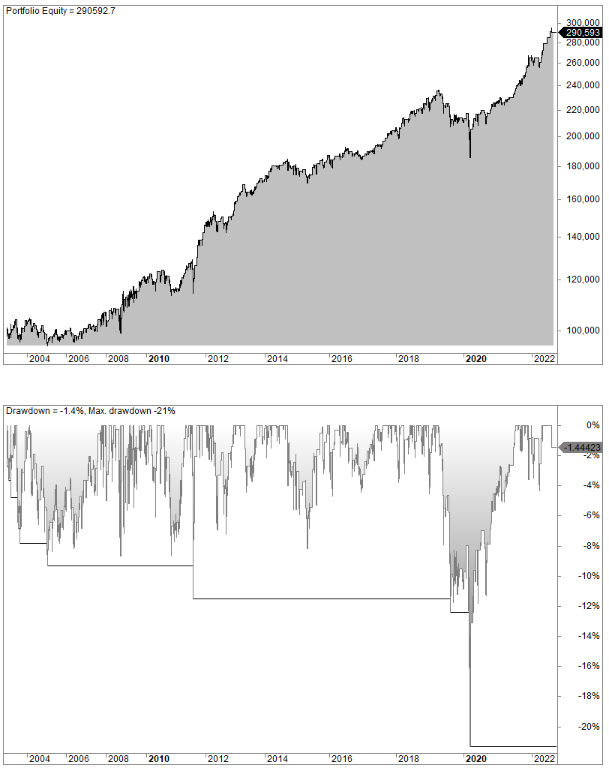
There are 578 trades and the average gain per trade is 0.4%. Interestingly, all the gain comes from the long side – shorts are breaking even. CAGR is 5.5% and risk-adjusted return is 13%.
If we only take long trades the equity curve looks like this (though assuming we now invest 100% on each trade):
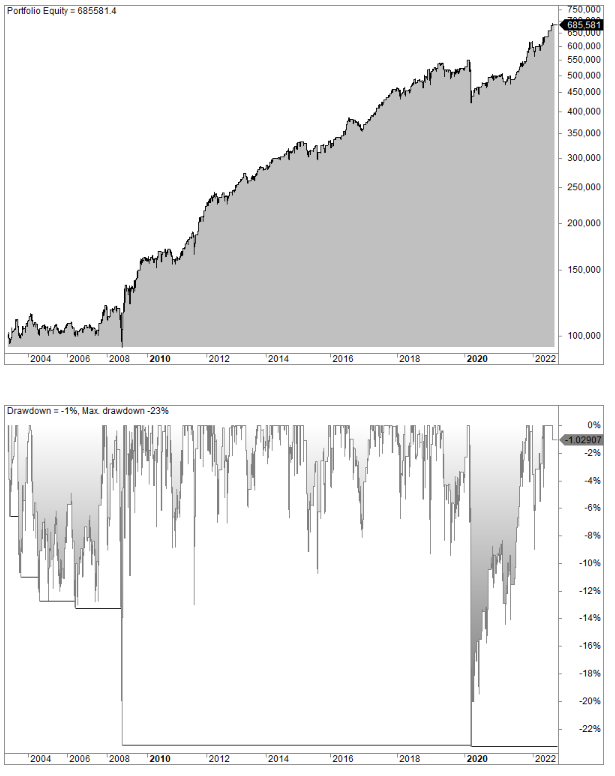
It’s a rather bumpy ride but the CAGR is 10.1% (0.71% per trade) and the risk-adjusted return is 23% because of the much lower drawdowns than buy and hold.
(If you want to read more about risk-adjusted returns, please read our article about trading performance metrics.)
QQQ/TLT ratio
The simple backtest shows that the QQQ/TLT ratio seems to have some predictive value and the market neutral position cushions a lot of volatility.
FAQ:
What is the QQQ/TLT ratio, and why is it important?
The QQQ/TLT ratio represents the relationship between the Nasdaq 100 ETF (QQQ) and the 20(+)-year Treasury Bonds ETF (TLT). It is significant because it reflects the market’s perception of risk, particularly the divergence between stock prices (QQQ) and bond prices (TLT).
What is the significance of the divergence between stocks and bonds?
The divergence between stocks and bonds is noteworthy as it deviates from the typical relationship where rising interest rates are considered unfavorable for stocks. Understanding this divergence can offer insights into market sentiment and potential trading opportunities.
What trading strategy is associated with the QQQ/TLT ratio?
The trading strategy involves creating a spread of QQQ and TLT, calculating a 5-day RSI of the spread, and making trading decisions based on RSI values. When the RSI is below 25, it suggests a long position in QQQ and a short position in TLT. Conversely, when the RSI is above 75, it indicates a short position in QQQ and a long position in TLT.