
Negatively Skewed Distribution in Trading Strategies – Definition, Example, Histogram (Fat Tail Analysis)
What is negatively skewed distribution in trading strategies? Negatively skewed trading strategies are “accidents waiting to happen”: You have many small winners and rare big losers. Unfortunately, the big losers can put you out of business.
This is what a negatively skewed distribution in trading strategy is – you need to understand the profit distribution of the strategy. Unfortunately, most traders don’t know that they are trading negatively skewed strategies until they blow up. We provide an example of a negatively skewed distribution (of a trading strategy).
Some years ago I traded proprietary with Echotrade. I remember what one of its principals said about new pair traders that started trading with them: oh no, he’ll make a lot of steady money, but ultimately he’ll lose it all, and perhaps even more. His experience was based on the objective numbers from the firm: pair traders did not last long. Why is that? It’s because of a negatively skewed trading strategy.
The majority of pair traders play the Martingale strategy*: they add to losers. Problem is, you get away with this most of the time.
However, once in a while you get stuck into a pair that does not mean reverse. The loss simply gets bigger and bigger until the account is wiped out or you are being asked for more margin.
When I started trading in 2001, I remember one trader doing merger arbitrage. The spread grew bigger and bigger but he kept on adding new positions. Later the deal was called off. In the end, he lost five years of profit and gave up trading.
What is a negatively skewed distribution in trading?
Skewness has a probability distribution that is not normally distributed.
Distribution refers to the profit and loss distribution of a strategy. When it’s negatively distributed, or skewed, there are more observations on the right side of the y-axis, but the left side of the y-axis is longer and thus contains many more big losers than comparatively winners on the right side.
Negatively skewed trading distribution in strategies have fat tails
A fat tail implies a profit distribution that has skewness. This could be on the left or right side. Obviously, if it’s on the right side the trading strategy has positive skewness.
Opposite, if it’s on the left side the fat tail has negative skewness. Below is an example of a trading strategy that is negatively skewed and thus has a left fat tail:
What does a negatively skewed histogram look like? An example
The chart below is a good example of how such a negatively distributed/skewed profit distribution trading strategy:
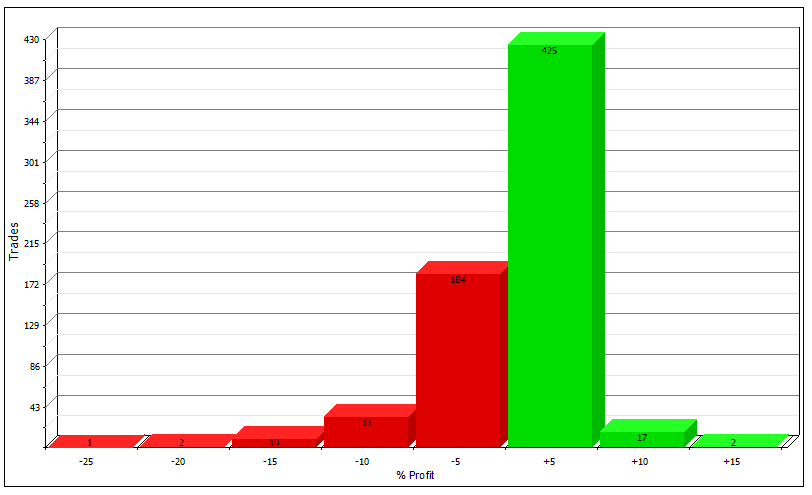
The example shows many winners, but it has only 19 winners of more than 10% compared to 46 losers bigger than 10%.
Such a distribution is quite common in mean-revertive strategies. It doesn&#