
4-Year Presidential Election Cycles in the Stock Market – Election Year Seasonality
In the United States, a presidential election is held every four years. Those presidential elections have been observed to affect many government sectors, including legislation, international relations, and even the stock market. This occurrence inspired the concept of 4-year presidential election cycles in the stock market. But what exactly are they?
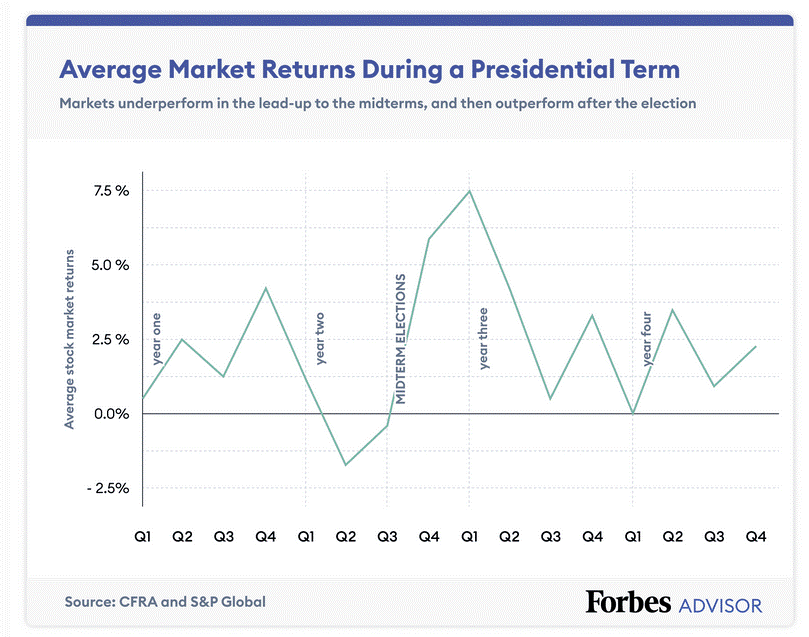
The presidential election cycle theory is a stock market performance theory that asserts, based on historical data, that the stock market’s performance in the first two years of a U.S. president’s term will likely outperform the stock market’s performance in the last two years of a U.S. president’s term. Furthermore, midterm election years show poor performance up until the 4th quarter.
The Presidential Stock Market Cycle – backtest end empirical results
Before we go on to explain the Presidential Cycle in detail, we jump straight to the presidential election cycle theory backtest. Because there already exists a lot of work on the subject we refer to previous work instead of doing our own.
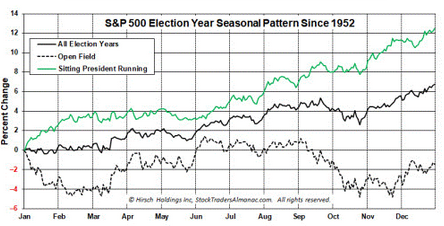
Yale Hirsch was, to our knowledge, the first to quantify the effect of the Presidential Cycle and its effect on stocks. In the Stock Trader’s Almanac 2020, the 53rd edition of this great book, they updated their findings. We quote from the book about 4 year stock market cycle:
Presidential incumbency is a powerful phenomenon and the driving force behind the 4-Year Presidential Election Cycle. This quadrennial quadrille is what has made the Pre-Election Year the best year of the cycle and Election Year second best. Since 1952 S&P 500 is up 12.5% on average in election years when a sitting president is running for reelection vs. 6.7% in all election years and –1.5% in election years with an open field and no incumbent commander-in-chief running for a second term.
Mid-term election years and stock market returns
Stock Trader’s Almanac also writes that the midterm election year shows that the second year has generally been the weakest in a president’s term (2022 is such a year, 2018 as well – the two last ). That is, up until the 4th quarter which has seen the best performance in the presidential cycle:
Because the markets tend to be weak in the midterm elections, volatility picks up:
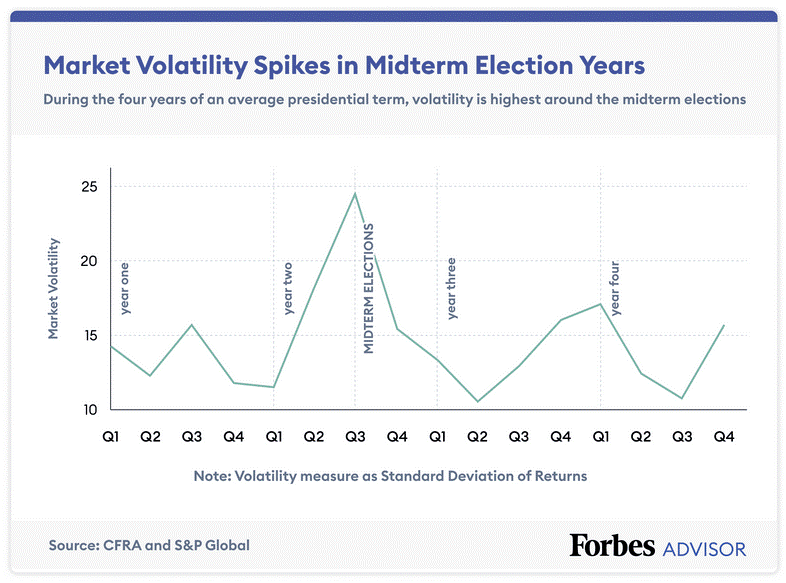
Volatility normally picks up in bear markets because the world looks more fragile. You can read more about this in our anatomy of a bear market.
What is the Presidential Cycle?
Based on historical data, it has been observed that the stock market’s performance in the first two years of a U.S. president’s term is likely to be better than its performance in the last two years of a U.S. president’s term.
Yale Hirsch, the founder of Stock Trader’s Almanac, is credited with formulating the presidential cycle theory. Hirsch found that equity market returns follow a predictable pattern when a new president is elected in the United States.
According to this idea, stock market performance in the United States is poorest in the first year, then improves, peaking in the third year before dropping in the fourth and final year of the presidential term. After that, the cycle begins again with the next presidential election.
Understanding the Presidential Cycle – Stock Market In Election Years
In 1967, Yale Hirsch, a stock market researcher, published the inaugural edition of the Stock Trader’s Almanac. They showed that the presidential election cycle, which happens every four years, is a significant indicator of stock market performance. According to their findings, the outcomes are relatively steady, regardless of the president’s political leanings in office at the time, and the year after each presidential election marks the start of a new four-year stock market cycle.
The theory indicates that the stock market performs the worst during the first two years of the cycle. This is because wars, economic downturns, and bear markets are more likely to happen in the first half of a president’s term, while bull markets are more likely to occur in the last two years. As the following election approaches, the model suggests that presidents focus on growing the economy.
Some feel this is because presidents, competing for re-election, emphasize economic stimulus during the second half of their terms. The stimulus is intended to boost the stock market, making it easier for the incumbent president to win re-election.
For example, features of the presidential cycle could be seen in the years after Richard Nixon’s election in 1968. The Dow Jones Industrial Average fell 15.2 percent in 1969, then rose 4.8 percent, 6.1 percent, and 14.6 percent the following years. Some people thought that President Nixon was to blame for the slow but the year was followed by a steady rise in stock prices over the four-year cycle because he was trying to get re-elected.<