

Shooting Star Candle Strategy: (Statistics, Facts, & Historical Backtest)
Candlestick patterns provide plenty of insight into how the price moved in the recent past and how it might move in the near future. Some traders use these patterns to signal trade entry and exit points. While there are many such patterns, only a few may be effective, and one of them is the shooting star candle pattern. What is the shooting star candle strategy?
The shooting star pattern is a bearish reversal pattern that consists of just one candlestick and forms after a price swing high. It is seen after an asset’s market price is pushed up quite significantly but then gets rejected at higher prices, which indicates that the price may be about to decline.
Thus, the shooting star candle strategy is a short-selling strategy that can be used to identify short-selling opportunities in the market, especially in a down-trending market or a range-bound market.
In this post, we take a look at the shooting star candle strategy. Unlike most other websites, we’ll go on to backtest the performance of the shooting star with strict trading rules (at the end of the article).
All you need to know about candlesticks
Before you read on, we’d like to mention our research on candlesticks and performance. We quantified all 75 candlestick patterns and converted them into strictly defined patterns and backtested them. We have made this research available for a small fee. Please read more here:
What is the shooting star candle strategy?
In candlestick analysis, the shooting star pattern is a bearish reversal pattern that consists of just one candlestick and forms after a price swing high.
Also known as the bearish pin bar among western traders using the bar chart, the formation is seen after an asset’s market price is pushed up quite significantly but then gets rejected at higher prices, which indicates that the price may be about to decline.
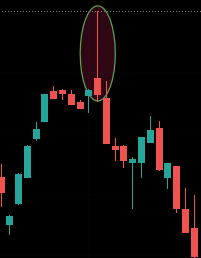
Thus, the shooting star candle strategy is a short-selling strategy that can be used to identify short-selling opportunities in the market, especially in a down-trending market or a range-bound market. It can be used in any timeframe, as the pattern can form in any timeframe.
The pattern is formed when the price trades higher during a trading session and later declines to close around the opening price of the session. This creates a long upper wick, a small body, and little or no lower wick.
The pattern must appear at the top of an upswing, and the upper wick must take up more than half of the length of the candlestick for it to be considered a shooting star. It must not be confused with the inverted hammer pattern, which is a similar pattern that forms at the bottom of a downswing.
While the shooting star candlestick pattern is often thought to be a possible signal of bearish reversal, the inverted hammer pattern is considered a bullish signal.
Related reading: Pin Bar Trading Strategy (Rules And Backtest)
Where does the shooting star candlestick come from, and what is its history?
The candlestick chart was believed to have originated from Japanese rice merchants and traders who invented it to track market prices and daily momentum. The origin can be traced to a rice trader in Japan named Homma Munehisa in the 18th century AD.
Thus, the charting method was in use in Japan for hundreds of years before becoming popularized in the Western world. It was introduced to the Western world by Steve Nison in his book Japanese Candlestick Charting Techniques, first published in 1991.
Steve Nison found that there are certain patterns in the chart that Japanese traders use to identify trading opportunities. One such pattern is the shooting star pattern.
What are the rules of the shooting star candle strategy?
As a price action trader, there are many things to look out for when using the shooting star pattern to identify a trading opportunity. The first thing is how to identify the pattern, and the other is how to trade it.
Rules for identifying the candle pattern
The wicks: The shooting star candlestick has a long upper wick and little or no lower wick. The long upper wick is known as the tail, while the short lower wick is called the nose. The upper wick is usually more than half of the entire range of the candles and about twice or more the size of the body.
The body: The body is the part between the opening price and the closing price. It is usually small — about 1/3rd the range or less — and positioned near the lower end. The body can have a bullish (green) or bearish (red) color. It takes a bearish color if the trading session closed below its opening price, and when the trading session closes above its opening price, the body of the shooting star pattern will have a bullish color.
But whatever the color of the body, the shooting candlestick pattern has a bearish implication — the bearish