
Supertrend Indicator Trading Strategy – (Backtest And Performance)
In this article, we will discuss an indicator called SuperTrend, which has a very promising name. So, what is the Supertrend Indicator Trading Strategy exactly?
The SuperTrend indicator is a type of trend following indicator that was created by trader Oliver Seban. It signals the direction of a trend, its continuation, or changes in direction. Our backtest reveals that the indicator can catch most of the returns while avoiding the worst drawdowns, thus giving acceptable risk-adjusted returns.
In the rest of this article, we will test its effectiveness and explain how it works.
What is the Supertrend Indicator Trading Strategy?
Oliver Seban has given us a great tool for highlighting the direction in which an instrument’s price is moving. However, as we will see, the SuperTrend Indicator is useful not only for chartists but also for those who want to do algorithmic trading.
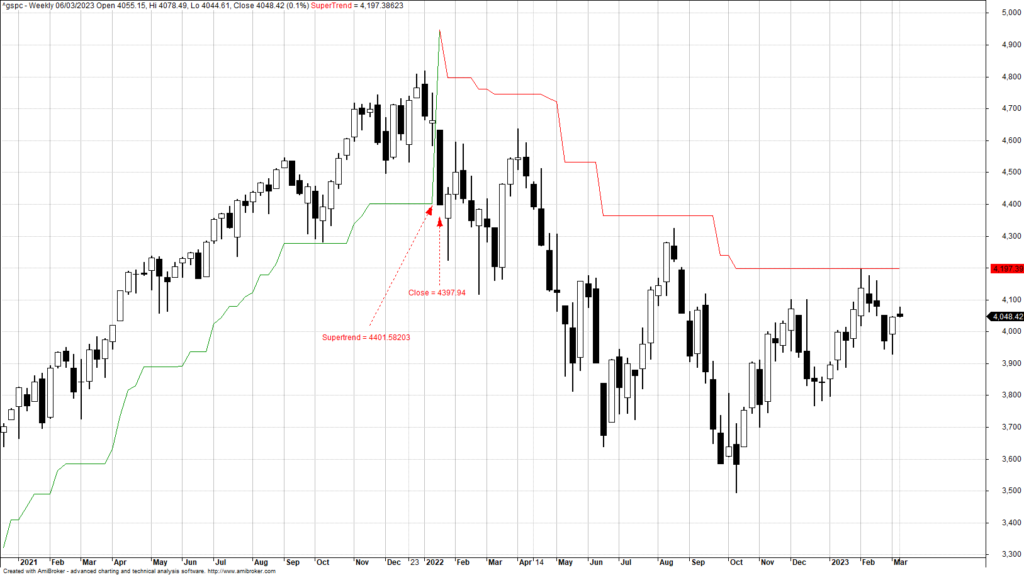
The SuperTrend indicator appears as a line superimposed on the price chart. If the price increases, it will be above the Supertrend indicator, which will be green. Vice versa, if the price is decreasing, it will be below the indicator, which will be red.
If the price of a bar closes by crossing the previous period’s SuperTrend indicator value, the SuperTrend indicator will reverse direction, indicating a trend change. We observe this feature in the image:
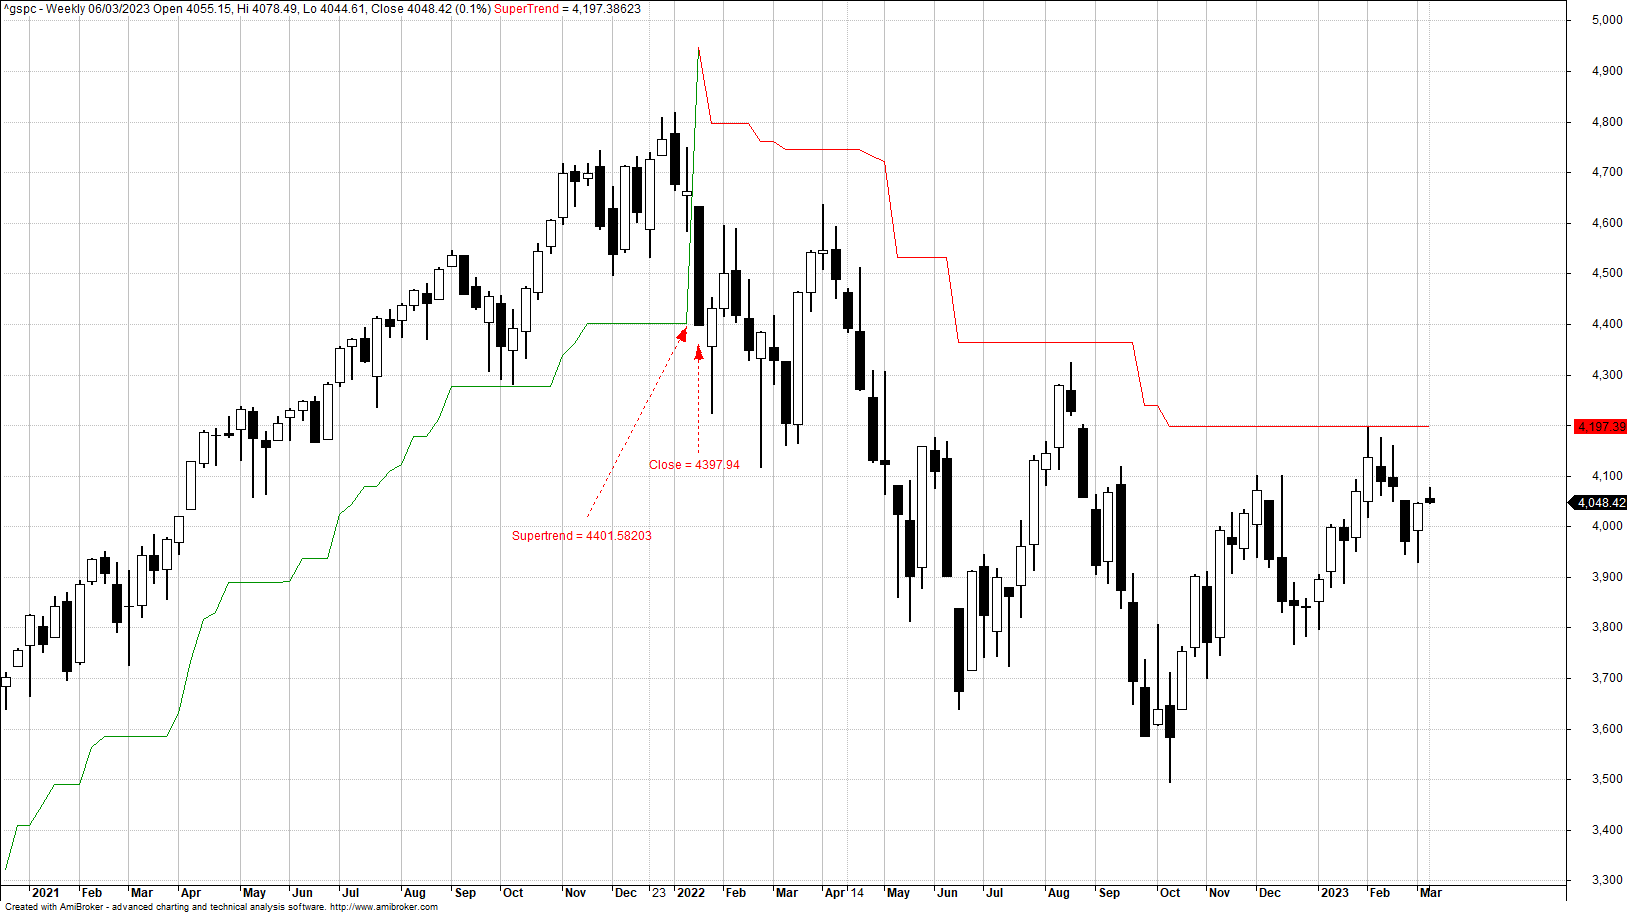
In the chart above, the close of the candle at 4397.94 determines the inversion of the Supertrend indicator because this value is lower than the value of 4401.58203 that the indicator had in the previous period.
Another important feature that we can see in the image above is that the Supertrend indicator is always increasing when it is below the closing price and always decreasing when it is above it.
We can therefore say that the Supertrend