The Best And Worst Trading Days Of The Month (Table – Member Article)
We made a table that summarizes the best and worst trading days of the month.
Because the length of the month varies from month to month (and some months have holidays), we made two tables: one from the start of the month and one that goes backward (N-days to next month).
Trading Rules
[am4show have=’p2;p3;p58;p59;p130;p138;’ user_error=’Premium Post Access’ guest_error=’Premium Posts’]
The return is calculated from the close to the close. For example, The first trading day of the month is from the close of the last month until the close of the first trading day.
The period is from 1960 until today and the index used is the cash index of S&P 500. Because it’s a cash index (which does not include dividends), the results might vary if you use a tradable instrument like SPY or @ES. Always backtest yourself!
[/am4show]
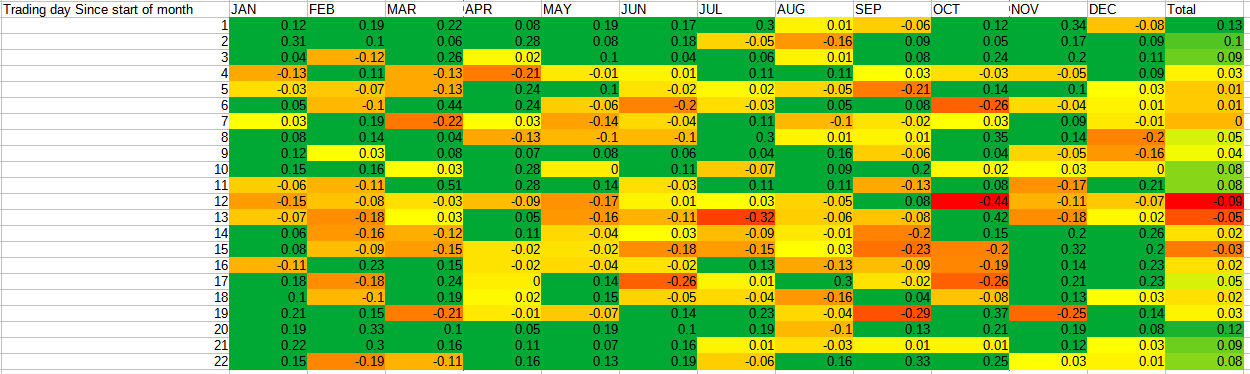
This is the results for trading day N of the month:
If we measure trading day N until the new next month, we get the following table:
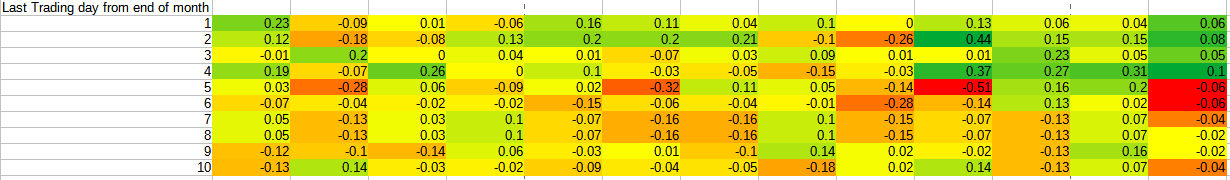
(1 is the last trading day of the month, 2 is the second last, etc.)
It’s pretty evident when you want to be invested in stocks, and when the odds might be better than random.
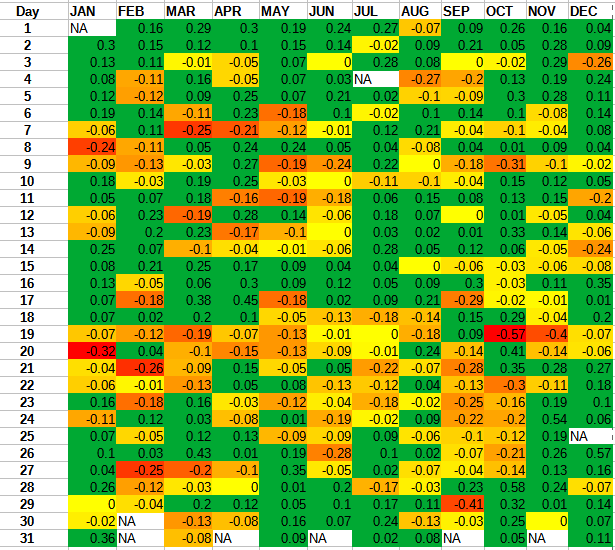
If we look only at calendar days, we get the following table: