
The Overnight Edge – Assessing Its Current Effectiveness
One of the best edges in the stock market is the overnight edge – the price action from the close until tomorrow’s morning (or close). Is it still working? Can a trend filter improve performance?
Empirical evidence – the overnight edge:
The overnight edge is best illustrated by a simple backtest and a chart.
[am4show have=’p2;p3;p58;p59;p130;p138;’ user_error=’Premium Post Access’ guest_error=’Premium Posts’]
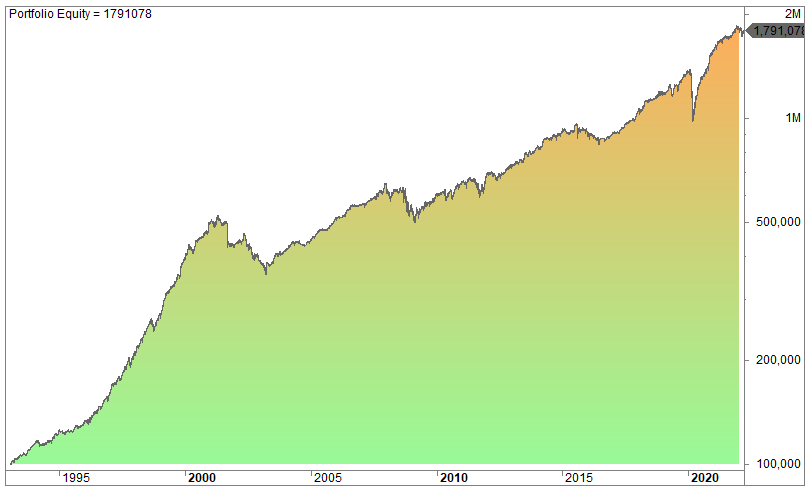
This is the equity curve since 1993 if you bought every close and sold at the open the next day:
Compare this to if you bought every open and sold at the close the very same day (day trading):
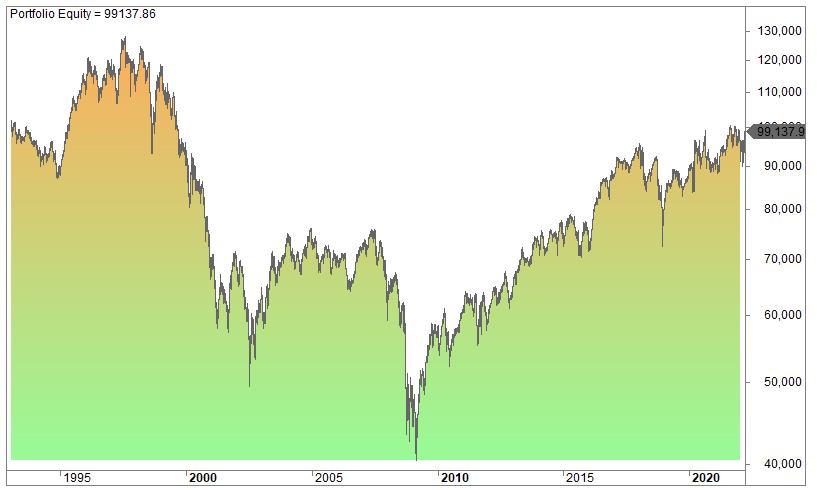
For almost 30 years you would have experienced a small loss if you bought the open and sold at the close.
Thus, all the gains since 1993 have come while the stock market was officially closed!
30 years is a long period. Let’s narrow down and look at the performance since 2020.
This is the close to the next open:
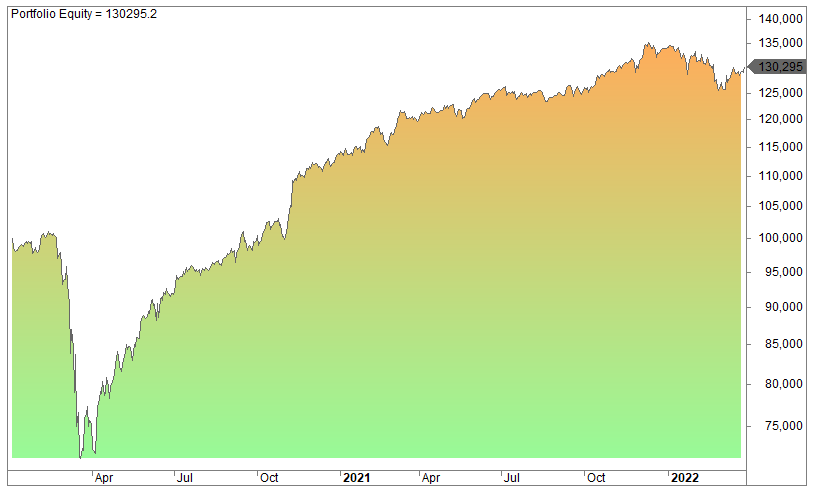
The Covid-19 mess made a dent in the equity curve but has since performed well. The overnight is no magic bullet but performs poorly in a bear market.
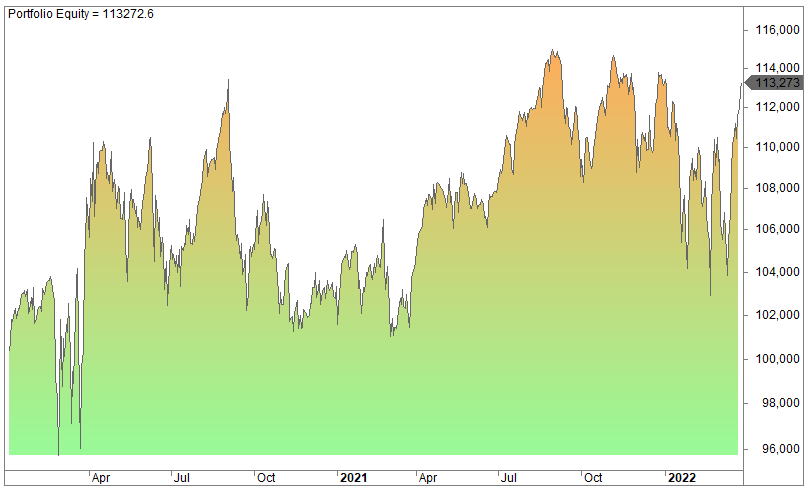
This is from the open to the close:
Inserting a trend filter
If we put in a trend filter, for example a requirement that the close must be above the 200-day moving average, it performs slightly better.
[/am4show]
The chart below shows the performance from the close to the next open (the overnight edge):
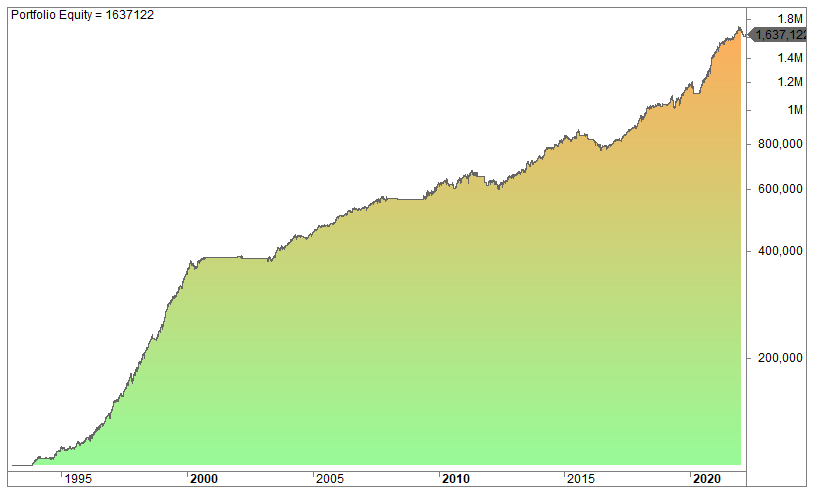
The end result is more or less the same while drawdowns and time spent in the market are reduced. Thus, we can argue the risk-adjusted return is improved. Please read our article about trading strategy and system performance metrics.
And this is the day trade from the open to the close: