
The Holiday Effect in Stock Markets: Strategies and Seasonal Insights
The Holiday effect system in the stock market is a well-known anomaly and seasonality. Is there a way to profit from the holiday effect seasonality? Are there any holiday effects in the stock markets? If so, which holiday is the best?
The holiday effect strategy seems to be significant for Independence Day, Thanksgiving, and Christmas. In this article, we look at seven different holiday effects and seasonalities in the US stock market. We look at how the S&P 500 performs before and around these holidays.
What is the holiday effect trading strategy in the stock market?
The pre-holiday effect can be used as seasonal trading strategies. The holiday effect can also be called a calendar effect, which tends to give increased returns in stocks over a short period of time. These situations tend to happen around holidays, like for example the 4th of July. The days before the holiday, but often also the days right after the holiday, are assumed to show consistent positive patterns and returns.
The holiday effect trading system is widely analyzed and well known. Despite this, we know very few traders who actually trade the holiday patterns. Is there a logical reason for this? In this article, we try to find the most profitable patterns.
To those who believe such an effect will make them rich, we have to disappoint you. The holiday effect is tiny but still abnormal in a few of them. It’s not a get-rich-quick scheme but could be a useful addition to your arsenal of trading strategies.
The holiday effect is not only happening in the US. This is a phenomenon that has been documented in multiple countries across the globe.
Fundamental reasons for the holiday effect in the stock market
Why is there a holiday effect in the stock market?
One reason could be lower liquidity as many go on holiday. When liquidity drops, it creates a “vacuum” that means buyers need to pay up to buy shares.
Why would they pay more for the shares? The reason could be more optimism around holiday times.
Another reason could be the lack of macro news. When there is no macro news, the stock market tends to drift upwards. Volatility normally picks up when there is bad news, rarer when there is good news.
A third reason could be that participants sell their risky assets prior to the holiday season in order to reduce risk. This, of course, could lead to selling pressure and thus lower prices ahead of the holiday season. When the sellers are done, the prices gradually drift up again. As mentioned above, this creates a “vacuum”.
How to measure the holiday effect on stocks
In this article, we look at the S&P 500 because it’s the most important index in the world. We use both the ETF with the ticker code SPY but we also use ^gspc to look at data earlier than 1993. Both are downloaded for free from Yahoo!finance.
Some traders might disagree with how we test the holiday effect anomalies. That’s fine. There are no definite answers and others might have something that works better.
As always, we are always happy if others are willing to share their insights and knowledge in the comments section.
S&P 500 returns by month since 1960:
Before we start we want to have a look at the monthly returns per month in the S&P 500. This is to make a benchmark to measure the outperformance of the holiday effect.
Why is this important?
It’s important because some months are much better than others. Is the specific holiday effect good because of the pattern in that month or vice versa?
Nevertheless, here are the monthly returns in the S&P 500 from 1960 until 2021:
- January: 1.07%
- February: 0.08%
- March: 0.96%
- April: 1.56%
- May: 0.23%
- June: -0.01%
- July: 0.71%
- August: 0.22%
- September: -0.61%
- October: 0.94%
- November: 1.57%
- December: 1.33%
Clearly, the best period is from October until the end of April. This period has practically made all the gains in the market over the last 60 years. This effect we have previously documented in this article:
The Martin Luther King Jr. Day holiday effect:
The first holiday of the new year is the Martin Luther King holiday. The holiday is always on the third Monday in January and the stock market is closed to observe the day. The earliest date for the holiday is January 15 and the latest is January 21.
Let’s test the following hypothesis:
Trading Rules
[am4show have=’p2;p3;p58;p59;p130;p138;’ user_error=’Premium Post Access’ guest_error=’Premium Posts’]
- We go long at the close on the first calendar day of the month which is higher than 11.
- We exit at the calendar day 21 or more.
[/am4show]
The equity curve looks like this in SPY:
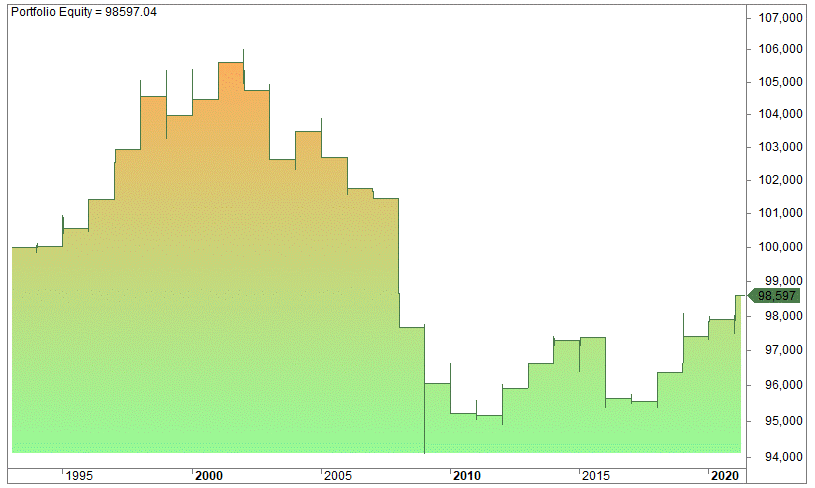 The stock market seems to get very little help from the murder of Martin Luther King, even though January is one of the best months over time. There are 29 trades, the average gain is -0.05%, the win ratio is 57%, the profit factor is 0.9, and the max drawdown is 11%.
We have made a more detailed study about The Martin Luther King Jr. Day Holiday Effect In Trading.
George Washington Day/President’s Day holiday effect:
The second holiday of the year is President’s Day, officially called Washington’s Birthday, and is always on the third Monday