
Trend Reversal Trading Strategies – Setup, Rules, Backtest, Performance Analysis
A trend reversal is a change in the direction of the price trend of an asset. This change in direction can be to the upside or downside. The trend reversal strategy is any analysis or trading technique a trader uses to identify the end of one trend and the beginning of another. Trend-reversal strategies can be used on any timeframe and can mean the difference between a big win, a break-even, or a loss, as being able to effectively spot a reversal is the fastest way to get into a potentially profitable trade.
In this post, we take a look at the trend reversal trading strategy, and we have also included a backtest.
Trend Reversal Trading Strategies
“The trend is your friend until the end when it bends.” — Ed Seykota. No matter the strength and duration, most trends would eventually come to an end, so it pays to know how to spot that when it happens. So, what is a trend reversal strategy?
Before you start reading, we list our articles that can be labeled trend reversal trading strategies:
- Reversal Day Strategy Backtest – Does It Work? (Market Turnaround)
- Averaging Down Trading Strategy (How, Setup, Rules, Backtest, Returns)
- Reversal Trading Strategy in S&P 500 (Rules, Setup, Backtest, Performance)
- Bear Trap Trading Strategy (Rules, Backtest, Performance)
- Monday/Tuesday Trade In Nasdaq In The S&P 500 And Nasdaq (Trend Reversal)
- 123 Pattern Reversal Strategy – Setup, Rules, Backtest, Performance
- Mean Reversion Trading Strategies and Backtest
- The Turnaround Tuesday Trading Strategy (Setups, Rules, Performance)
- ATR Bands Trading Strategy: Tips & Tricks (Backtest)
Related reading: – Are you looking for other trading systems? (We have plenty more)
What is a trend reversal?
A trend reversal is when the price direction of an asset has changed, and the change can be to the upside or downside. A trend reversal signals the end of one trend and the beginning of another.
Thus, a reversal following an uptrend would be to the downside, while a trend reversal following a downtrend would be to the upside. Reversals tend to be based on the general price direction rather than just one or two periods or bars on a chart.
Since price trends can occur on any timeframe, trend reversals can also occur on any timeframe. Different traders trade different timeframes, depending on their trading style, so anyone can make use of trend reversal strategies, regardless of the timeframe on which they trade.
While an intraday reversal on a five-minute chart doesn’t matter to a position trader who looks for a reversal on daily or weekly charts, it would mean so much to a scalper monitoring the 5-minute and 1-minute charts.
As you should already know, an uptrend is a series of higher swing highs and higher swing lows, so when it reverses into a downtrend, you should expect to see a series of lower swing highs and lower swing lows. Likewise, when a downtrend, which is a series of lower swing highs and lower swing lows, reverses into an uptrend, you expect the emergence of a series of higher swing highs and higher swing lows.
You can identify trends and reversals using this characteristic price action pattern of swing highs and lows. In doing so, you may want to use a trendline to mark the ascending or descending swings, as the case may be.
Since an uptrend makes higher swing lows, its lower limit can be delineated with a trendline drawn along those ascending swing lows. So, when the price drops below the trendline, that could signal the reversal of the uptrend to a downtrend.
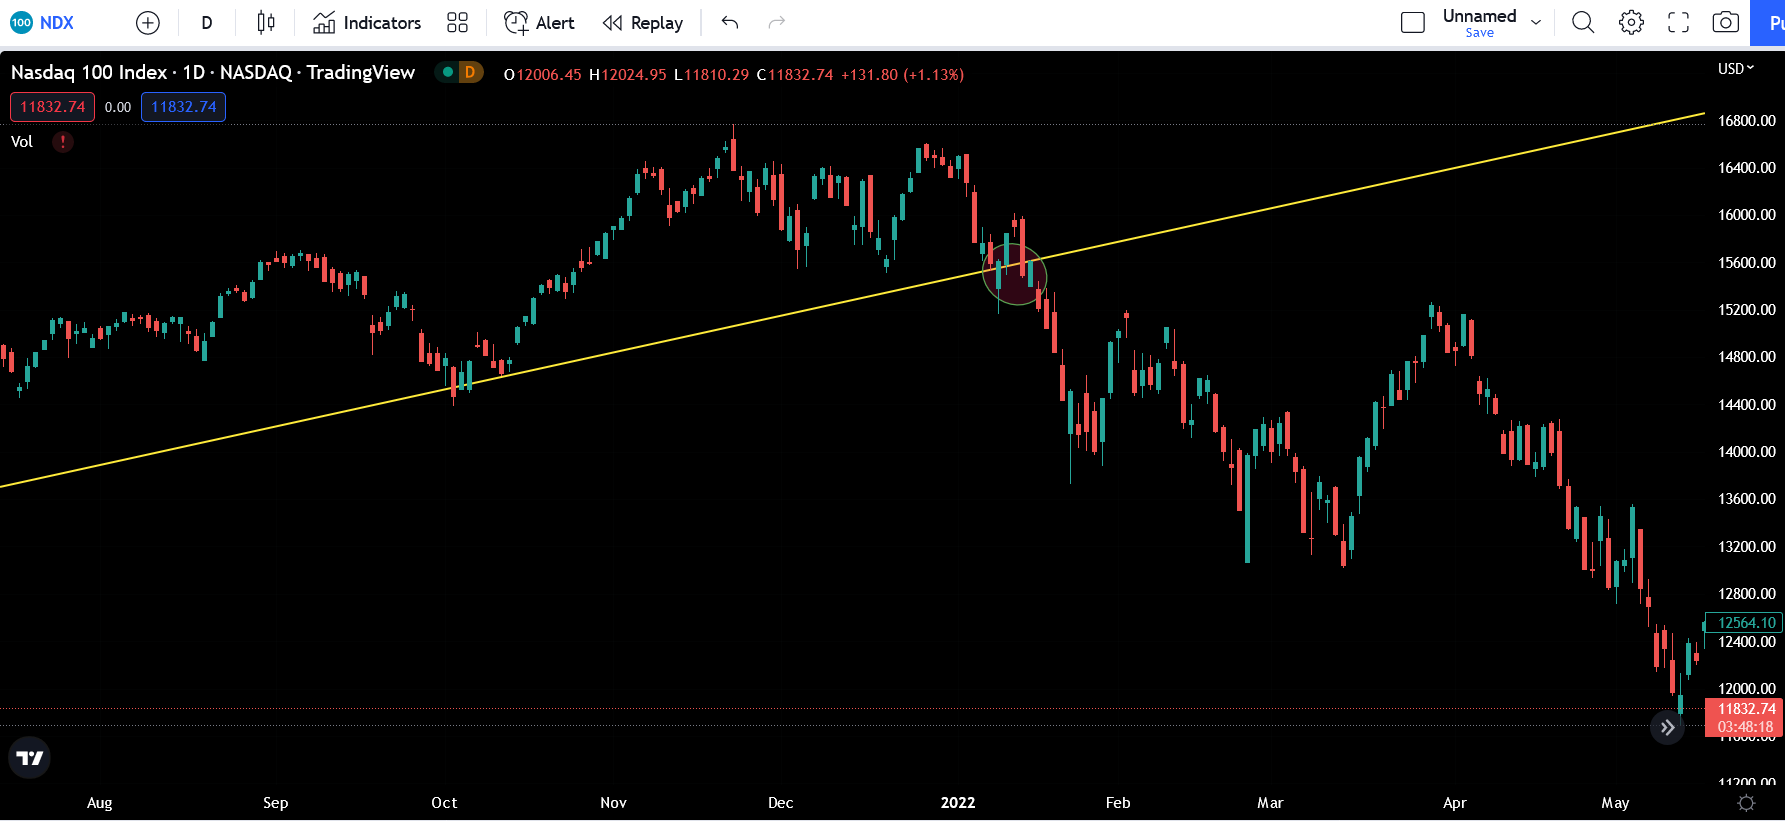
The opposite is true in a downtrend where the price pattern has descending swing lows: a trendline drawn across the descending swing highs can mark the boundary of the downtrend such that when the price rises above the trendline, that could signal the reversal of the downtrend to an uptrend.
Some traders prefer the use of indicators, such as a moving average, oscillator, or channels (Donchian, Keltner, and Bollinger Bands) to identify the trend