
11 Volatility Trading Strategies: Backtest, Rules, and Performance Insights
Volatility trading strategies can be very profitable. As an example, we show you an equity curve that only trades when volatility is above what is “normal”. We use a 200-day moving average as a filter for when we want to enter a trade. Because the volatility picks up when investors are “panicking”, we only look at trades when the SP 500 is below its 200-day moving average. When volatility picks up, even short trades become very profitable!
This article discusses different aspects of volatility trading strategies. Why volatility? In order to make money trading, you need prey. One of the prerequisites for trading is volatility. No volatility, no prey. No prey, no gains. Thus, it might pay off to trade during panics, stress, and volatility. It might be scary, but it’s normally during these times you can make decent profits. Here you can find more than 200 trading strategies similar to the above strategies.
(We have made potential trading strategies based on volatility. Please check out our volatility strategy bundles.) Before we discuss our S&P 500 index trading strategy, we share some words on when you are likely to see a volatile market.
Volatility is (mostly) synonymous with bear markets
A few weeks back we published an article about the bear market of 2000-2003:
- The anatomy of a bear market: 2000 – 2003
A trader should love a bear market for apparent reasons: volatility picks up and long-only strategies improve. Even better, short strategies become profitable! Short strategies in stocks are very rare because of the tailwind from the overnight bias: most of the gains in the stock market have come from the close until the next open.
What is volatility?
Volatility refers to the degree of variation in the prices of a particular asset or financial instrument over a given period of time. It is a measure of how much the price of an asset can fluctuate, and it is often expressed as a standard deviation or variance of returns.
High volatility means that the price of an asset is likely to experience significant swings in both directions, while low volatility means that the price is more likely to remain stable. Volatility can be caused by a variety of factors, such as economic news, political events, and changes in consumer sentiment.
Types of volatility:
- Historic volatility: This is the historical volatility of an asset, which can be calculated by looking at its price movements over a long period of time. Historic volatility can be a useful indicator of future volatility, but it is important to remember that the future is not always like the past.
- Implied volatility: This is the volatility that is implied by the prices of options contracts on an asset. Implied volatility is based on the market’s expectations for future price movements, and it can be a more accurate predictor of future volatility than historic volatility.
Volatility trading strategy
Which strategy can you use for volatility play? Below we share one example, (more strategies coming later in this article) even though we don’t reveal the code. We have plenty of free strategies on the website, and short strategies are hard to come by, at least in the stock market, and thus we want to save it for our paying customers. Below we have an equity chart that only takes trades when the close yesterday was below its 200-day average (plus two additional criteria):  The equity chart includes both long and short trades and has the following data:
 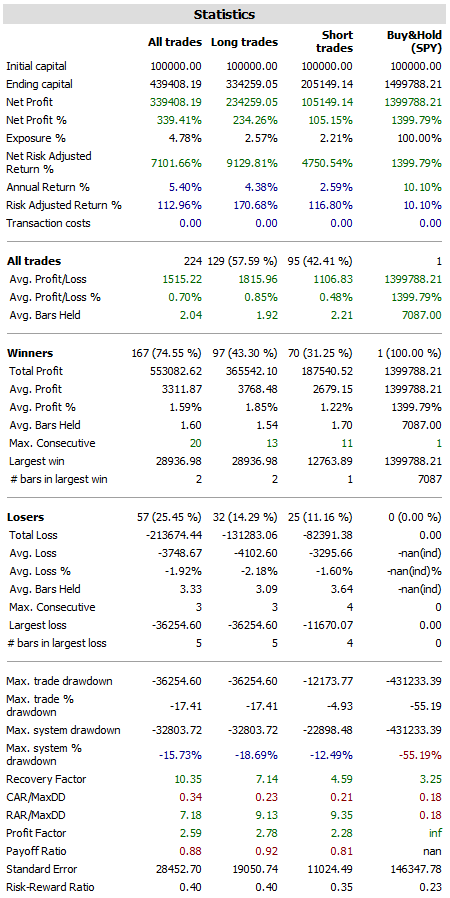 The S&P 500 Trading strategy’s three criteria for long and short are exactly the same except they are opposite (of course). About 45% of the trades are day trades, ie. both the entry and the ex