
Weekly Mean Reversion System for S&P 500 Stocks: Rules and Backtest Analysis
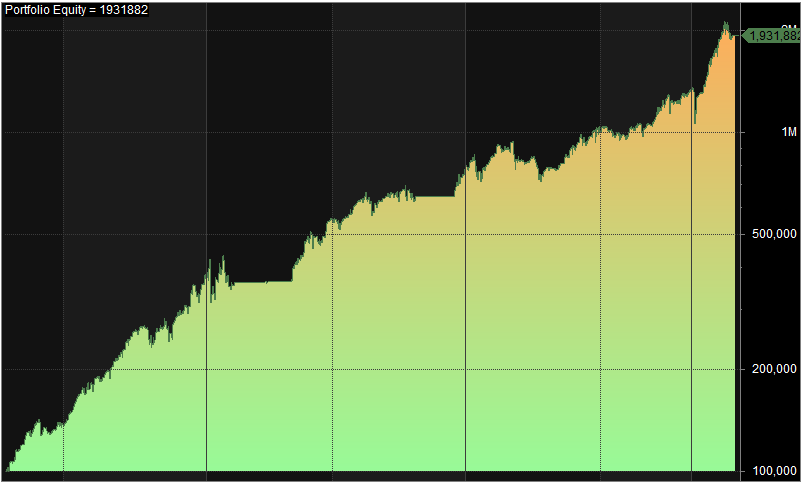
This article presents a stock trading system that only trades stocks. It has beaten buy&hold and (10.4% vs 7.5%) with a much lower drawdown. This is the equity curve and the complete trading rules are presented further down in the article:
What is a mean reversion system?
Mean reversion is a trading strategy based on the principle that over time, the price of an asset tends to revert to its historical average. In other words, if an asset’s price moves too far away from its average, it’s expected to return to that average eventually.
A mean reversion system is a type of trading system that uses this principle to make trading decisions. It typically involves identifying an asset that has deviated significantly from its historical mean, then buying or selling it in the hope that it will eventually revert to its mean. This strategy assumes that the asset’s price will eventually revert to its mean and generate a profit for the trader.
To implement a mean reversion system, traders typically use technical indicators such as moving averages, Bollinger Bands, or RSI (Relative Strength Index) to identify when an asset’s price is overbought or oversold. They then use this information to make buy or sell decisions.
Timeframe considerations: weekly vs. daily
The decision to use weekly bars instead of daily bars in trading depends on your trading style and the time horizon of your trades.
Here are some reasons why you might consider using weekly bars:
- Smoothing out market noise: Weekly bars can help smooth out the day-to-day fluctuations in the market, providing a clearer picture of the longer-term trends. This can help reduce the impact of short-term market noise and allow you to focus on the bigger picture.
- Better trade timing: Because weekly bars capture a longer period, they can help you identify key support and resistance levels, trend lines, and other important technical indicators more accurately.
- Reduce time commitment: If you are a part-time trader or have a busy schedule, using weekly bars can reduce the time commitment required to monitor the markets. You can check your charts once a week instead of every day, freeing up more time for family, friends, or other activities.
- Reducing transaction costs: By reducing the number of trades you make, you can also reduce your transaction costs. This is especially important for traders who trade frequently or have smaller accounts.
The strategy’s trading rules
With this strategy, we’re trying to benefit from weekly drawdowns/pullbacks in S&P 500 stocks – not the index.
[am4show have=’p2;p3;p58;p59;p130;p138;’ user_error=’Premium Post Access’ guest_error=’Premium Posts’]
Each weekend the 2-week RSI is evaluated for all stocks within the index. If the RSI value crosses below 25, a limit buy order is placed 5% below the last weekly close, valid for next week.
The position size for each position is 10% of the equity (make sure that the maximum number of positions is not exceeded). The position is sold at the next day open (Monday) as soon as the 2-weekly RSI exceeds 75.
Using weekly bars instead of daily bars makes it relatively easy to trade this system. There’s plenty of time on the weekend to check for new buy and sell orders and to put orders in the market.
No stop loss is used.
As we’re trading the stocks of the S&P500 index, meaning the 500 large