
Best Indicators For Swing Trading
Which is the best indicator for swing trading? There are many indicators to choose from, but in this article, we will try to answer which indicators that are best for this type of trading. There are many bells and whistles on the trading platforms, but we conclude that some indicators are much better than others.
One of the least known or used indicators is the best one for swing trading: Williams %R. We test six indicators and base our conclusions not necessarily on the highest return, but rather on the indicator with the best risk-adjusted return. Return must always be compared to the max drawdown.
Before we continue, let’s briefly define what we mean by swing trading:
What is swing trading?
Swing trading involves taking positions for a short number of days, normally between one day (even overnight trading) to a few weeks, but rarely longer than a month. The time horizon is longer than day trading, but shorter than position trading, and certainly much shorter than long-term investing which often involves years.
Technical indicators for swing trading has the potential for high returns and low drawdowns. However, small drawdowns are hard to control, you need to be disciplined, and you need to work hard all the time to develop new strategies.
What is risk-adjusted return?
What is risk-adjusted return in swing trading?
Risk-adjusted return is the relationship between the gross return compared to the maximum system drawdown (what is risk-adjusted return?). For example, if you have two systems with 15% annual returns, they might not be equal. It depends on how you got there.
As a swing trader, you prefer the least rocky path. You want to avoid bid drawdowns to minimize the probabilities of behavioral mistakes in trading.
Please read more about risk-adjusted return in our article about trading system performance metrics. Nevertheless, we copy and paste from that article how you can measure RAR/MDD:
First, we need to calculate the risk-adjusted return. This is the geometric return (annual) return in percent divided by the exposure in %. Exposure is the same as time spent in the market. If your strategy has 50 trades per year and makes 10% annual returns, this is more impressive than a strategy that returns the same but is invested 100% of the time. Time spent in the markets matter!
If the annual return is 15% and the exposure is 50%, then the risk-adjusted return is 15/0.5 = 30%
Now that we have defined the risk/adjusted return, we can calculate the RAR/MDD ratio assuming the max drawdown is 15%:
30/15 = 2
We would say that a metric better than 2 is very good.
As you can see, trading is all about risk and reward. Risk is defined as volatility and drawdowns. It’s not a perfect measure, but it is the best we have. Unfortunately, we can only calculate the risk of the past and not the risk of the future. We can only assume or estimate what the future risk is based on our backtests. Most traders assume they can stomach big drawdowns, but evidence indicates otherwise. Most people abandon ship in the middle of a storm.
Another risk, not frequently mentioned by pundits, is the win rate in trading. Most traders abandon a strategy after a few consecutive losses and this is why most traders struggle with trend-following strategies despite that trend-following works. Thus, always keep an eye on the win rate and the number of consecutive losers for a strategy.
What is a trading indicator?
Before we go on to backtest, we briefly explain what a trading indicator for swing trading is.
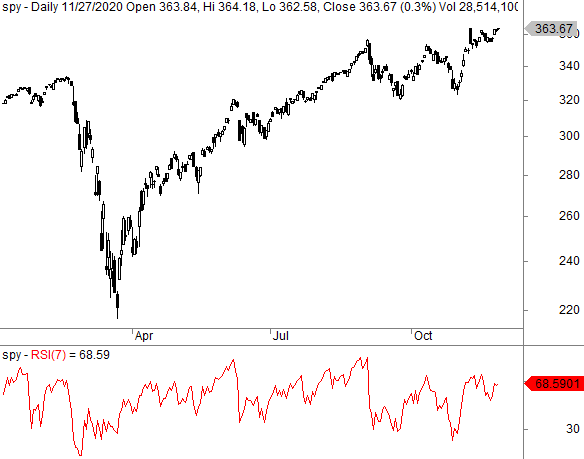
Most technical indicators are oscillating – meaning they go up and down within some upper and lower bands. The security in question is overbought when the reading is high and oversold when the reading is low. Most of them are mean-reverting indicators.
An example of a mean-reverting oscillator is the RSI:
The price of the security is in the