
123 Pattern Reversal Trading Strategy: Setup and Backtest
An essential part of technical analysis is studying the chart patterns, and one common chart formation is the 123-reversal setup, which appears at the beginning of many price reversals. But what is the 123 pattern reversal strategy?
The 123 reversal chart pattern strategy is a three-swing price formation that indicates a potential reversal in trend. It is formed by three price swings or waves with three swing points, which is where the name of the pattern comes from.
The 123 pattern reversal starts with the price swing not making the expected higher high (in an uptrend) or lower low (in a downtrend) and then breaking below or above a support or resistance level as the case may be. This change in price structure can help predict a potential reversal.
In this post, we take a look at the 123 reversal pattern. We end the article by making a backtest of the 123 reversal pattern strategy.
What is the 123 pattern?
The 123 reversal chart pattern is a three-swing price formation that indicates a potential reversal in trend. It is formed by three price swings or waves with three swing points, which is where the name of the pattern comes from. There is nothing special about the chart pattern, apart from the fact that the price swing is no longer making the expected higher high (in an uptrend) or lower low (in a downtrend). However, the change in price structure can help predict a potential reversal.
As with any trending market, the market makes higher highs in an uptrend and lower lows in a downtrend. But when the trend is about to reverse, the price deviates from that structure, making a lower high (in the case of a potential bearish reversal from an uptrend) or a higher low (in the case of a potential bullish reversal from a downtrend).
As you would expect, these are the two versions of the 123 reversal pattern: a potential bearish reversal from an uptrend and a potential bullish reversal from a downtrend.
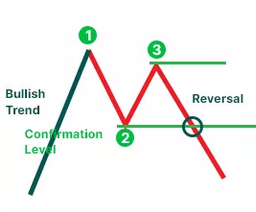
In the first case, the market is in an uptrend, making a series of higher swing highs and higher swing lows characteristic of a rising price. But at a time, the current price swing up doesn’t manage to rise above the previous high, giving rise to a lower swing high — an indication that the uptrend might be in danger.
If the next swing low breaks below the previous low, automatically implying a lower swing low, a bearish 123 pattern is confirmed, indicating that the prior uptrend has turned, as the recent price structure is now that of a descending market — lower swing high and lower swing low.
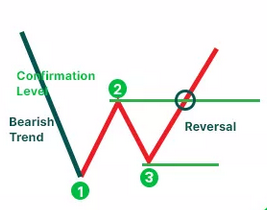
In the second case, the market is in a downtrend, making a series of lower swing lows and lower swing highs, which is characteristic of a down-trending market. However, at some point, the current price swing up doesn’t manage to fall below the previous low, giving rise to a higher swing low — an indication that the downtrend might be in danger.
If the next swing high breaks above the preceding swing high, automatically implying a higher swing high, a bullish 123 pattern is confirmed, indicating that the prior downtrend has reversed, as the recent price structure is now that of a rising market — higher swing high and higher swing low.
As you can see, the features of the 123 chart formation are almost