
S&P 500 Momentum Strategy – As Simple As It Gets (Rules, Setup and Backtest Results)
Momentum trading is the opposite of buying low and selling high: momentum is about buying strength. Can we make a successful momentum strategy for S&P 500?
Yes, a momentum strategy for the S&P 500 works. We use monthly bars and a simple moving average strategy crossover system.
Let’s show you why a momentum strategy works:
What is momentum?
First, if you are unsure what a momentum strategy is, we recommend an older blog post we made:
Does momentum work?
Momentum investing is an approach that seeks to buy stocks with the best historical performance over a given period and then periodically rebalance the portfolio such that at any given time, it’s invested in the stocks with the highest momentum.
This approach is based on the momentum hypothesis, which believes a strong correlation exists between 3-12 months ‘historical return and 3-12 months’ future return.
That is, stocks that performed the best over the medium term (3-12 months) are likely to continue performing well in the near future, say the next 3-12 months.
How momentum investing works
Here’s how it works:
- A momentum investor buys stocks that have performed best over the last 6 months (can be 3, 9, or 12 months)
- The investor rebalances his portfolio every month or 3 months by selling the least performing ones and buying new stocks currently performing better.
Why does momentum work?
We need to look at some facts to understand why momentum investing works:
Eric Crittenden of Long Board Funds published a fascinating blog post in 2016 called 80 Percent Of Stocks Have A Lifetime Return Of Zero.
Crittenden looked at the distribution of returns for all stocks listed between 1989 and 2015. Put short, over the long term, a small minority of stocks drive all the returns for the overall market!
Approximately 20% of all stocks accounted for all the gains during the period, meaning that the remaining 80% accounted for zero returns. During the same period, S&P was up 12-fold! The majority of the stocks ended up worthless.
It’s like the Pareto principle:
Roughly 80% of consequences come from 20% of causes – the 80/20 rule
This is what the distribution looked like:
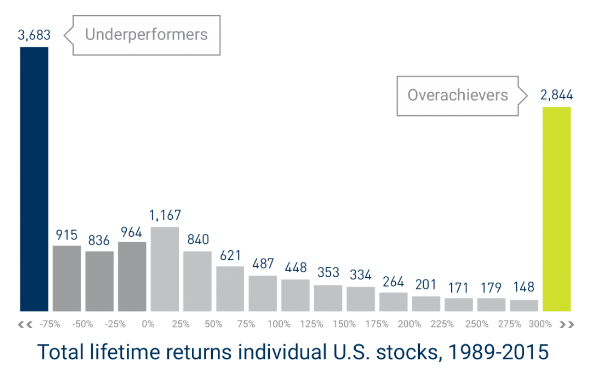
The chart is negatively skewed: many losers and a few winners that turn out to be