Using The Same Trading Strategy On All Indexes
If you have a potential trading strategy, which market are you going to backtest it on? And what do you do if it works on S&P 500 but not so well on Russell 2000?
This article uses the same trading strategy on four different US stock market indices to show the differences in returns and performance (depending on the stock index applied).
What is a stock market index, and what are the differences?
The S&P 500, Russell 1000, Russell 2000, and Russell 3000 are all stock market indices used to measure the performance of various segments of the U.S. stock market.
While they share some similarities, there are key differences between them in terms of the number of companies included and the size of the companies they represent.
Let’s look at the differences:
- S&P 500: The S&P 500, short for Standard & Poor’s 500, is a widely followed stock market index representing the performance of the 500 largest publicly traded companies in the United States. Companies are selected based on their market capitalization, liquidity, and industry representation. The S&P 500 is often used as a benchmark for the U.S. stock market and is considered a measure of large-cap stocks’ overall health and performance. It’s probably the most followed index in the world.
- Russell 1000: The Russell 1000 is an index that includes the largest 1000 companies in the U.S. equity market, based on market capitalization. It is a subset of the Russell 3000 index, which encompasses a broader range of companies. The Russell 1000 is typically used as a benchmark for large-cap stocks, as it represents the performance of the largest and most established companies in the U.S. market.
- Russell 2000: The Russell 2000 index focuses on smaller companies than the S&P 500 and Russell 1000. It includes approximately 2000 small-cap companies in the U.S. equity market. The selection of companies is based on market capitalization, with the Russell 2000 representing the bottom two-thirds of the Russell 3000 index in terms of market cap. The Russell 2000 is often used as a benchmark for small-cap stocks and is considered a measure of the performance of smaller, potentially higher-growth companies.
- Russell 3000: The Russell 3000 is a broad stock market index encompassing the largest 3000 publicly traded companies in the U.S. equity market. It is designed to comprehensively represent the U.S. stock market and includes companies of varying sizes, from large to small. The Russell 3000 is a benchmark for the overall U.S. equity market and is often used by investors and fund managers to evaluate their performance relative to the broader market.
In summary, the S&P 500 represents the largest 500 companies in the U.S., while the Russell 1000 includes the largest 1,000 companies, and the Russell 2000 focuses on smaller-cap companies. The Russell 3000 is the broadest index, encompassing 3,000 companies of varying sizes. Each index serves as a benchmark for different segments of the U.S. stock market.
What are the differences in terms of CAGR, exposure, maximum drawdown, etc., when the same strategy is applied to different stock universes? Let’s find out!
Strategy explained
We’re focusing on the same strategy we used in earlier articles:
- When To Sell? Unveiling the Best Trade Exits: Backtest Comparisons
- Unveiling the Best Trade Entries: Backtest Comparison Reveals Surprising Results!
- Weekly Mean Reversion System For S&P 500 Stocks
It’s a simple mean reversion strategy with solid results. The trading rules are as follows:
[am4show have=’p2;p3;p58;p59;p130;p138;’ user_error=’Premium Post Access’ guest_error=’Premium Posts’]
Buy rules:
- The stock needs to be part of the respective index:
- S&P 500
- Russell 3000
- Russell 1000
- Russell 2000
- 2-day RSI crosses below 10
- Entry on the next day open
- Stock price trading above 52-week moving average
- Position size: 10% each, the maximum number of simultaneous positions is 10
- If there are more signals than open slots, ranking based on the 52 weeks rate of change is applied
Sell rules:
- If the 2-day RSI crosses above 60, we sell at the next day’s open
Backtest settings:
- Time range: 2000-2022
- Data provider: Norgate Premium, survivorship-bias free
- Starting equity: $100000
- Commissions per trade: $2
[/am4show]
Strategy backtest and comparison
The base strategy, the one which focuses on the stocks being part of the S&P 500 index, won’t be discussed in detail as it was covered before in the linked articles above. With a CAGR of 17.8% and a maximum drawdown of -30.5%, it is a solid strategy but nothing one should trade out of the box. If you’re interested in the metrics, see the article here. All key metrics are again listed in a table further below for simple comparison.
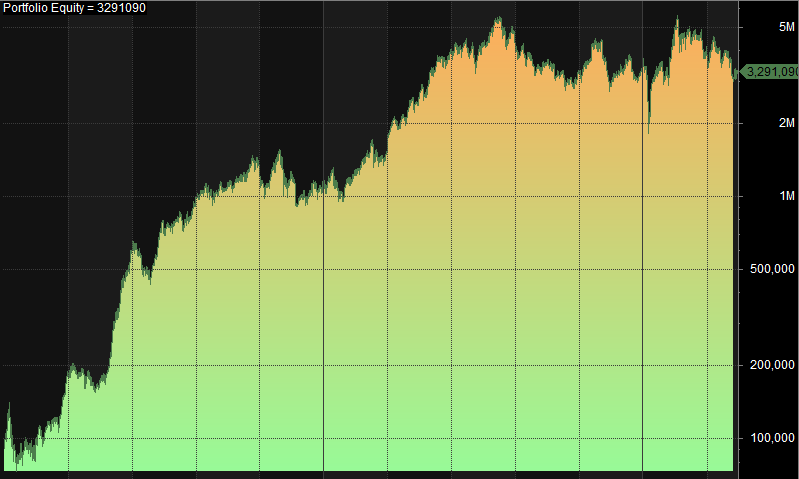
Increasing the stock universe from the 500 to the 3000 biggest publicly traded U.S. companies (Russell 3000) lowers the CAGR from 17.8% to 16.4%.
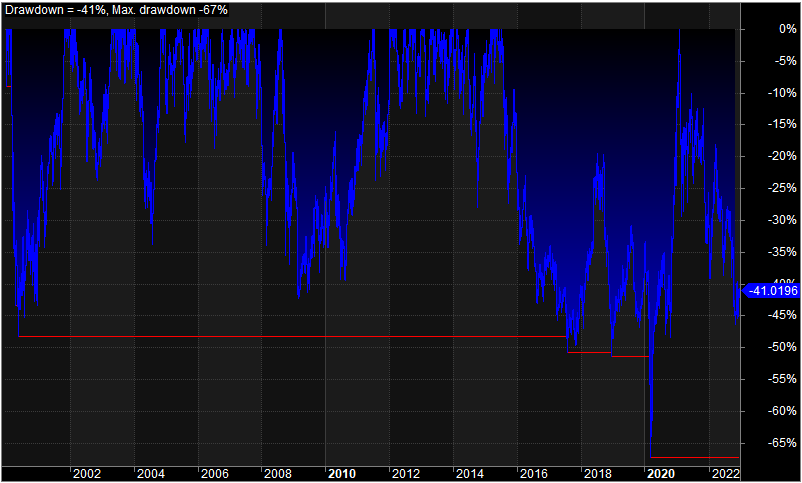
Comparing the number of trades, the strategy opens and closes more trades than before, thus increasing exposure. The equity curve is a bit more volatile, showing a severe drawdown in spring 2020 caused by the Corona pandemic. Although the strategy recovers afterward, it remains underwater by -41% by the end of 2022. Seeing the heavy drawdowns, one should think of a rule on how to mitigate the losses: