
How I Used TradingView To Create And Backtest An RSI Trading Strategy: A Step-by-Step Guide
Let’s see how to build a trading strategy based on the popular RSI indicator using TradingView (step by step) in the crypto market, from building the layout to implementing its native Pine Script language.
Our RSI-based trading strategy will seek reversals in the overbought and oversold zones. We will use DOT on a m5 timeframe with a 14-period RSI and 65/35 for overbought and oversold levels, respectively. Our Long signal will be when the RSI exits the oversold zone. Our Short signal will be when the RSI exits the overbought zone. We will exit the market at the mid level of the RSI (50).
Related reading: Free TradingView trading strategies
What is TradingView?
TradingView is one of the most widely used technical analysis platforms today due to its easy and intuitive interface, great data visualization capabilities, and above all, it can be used completely free, although with some limitations.
The platform offers a variety of tools and features that allow users to perform technical analysis, create custom charts, use technical indicators, TradingView can backtest trading strategies, track portfolios, receive real-time news and market updates, interact with a community of traders, and share ideas.
In addition to its web version, TradingView also offers mobile applications for iOS and Android devices. In the context of this article, we will focus on the tools that TradingView web allows us to use for free.
How to turn on RSI in TradingView?
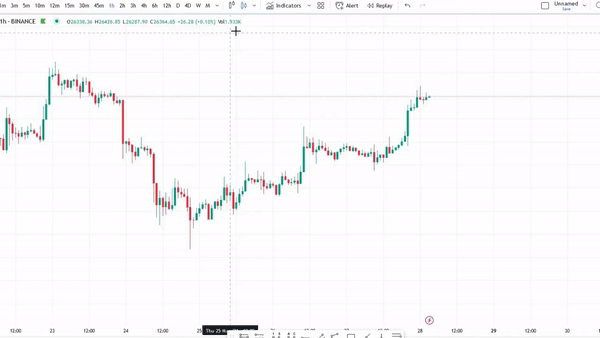
We will start by creating a New Chart Design in the top-right corner, and then we will search for the Relative Strength Index to add it to our chart. To do this, click on Indicators and type “RSI” in the search bar.
The indicator will appear at the bottom of our chart with its default parameters. If you want to modify it, simply hover over the indicator’s name, and the Settings icon will appear. Once the window is open, we can modify the indicator’s parameters as desired.
How to use RSI strategy in TradingView?
The RSI is used to measure the strength and speed of price movements of an asset, whether it’s upward or downward. It provides information about whether an asset is overbought or oversold, which can help investors and traders make informed decisions.
The levels of overbought and oversold are subjective to each trader and the asset they are analyzing, and they can represent extended price movements in a particular direction.
- RSI Trading Strategy (91% Win Rate)
- RSI Range-Momentum Trading Strategy (Backtest, Trading Rules & Example)
- How I Made An RSI Trading Strategy Using Python (Step-By-Step)
How to set up RSI in TradingView?
The RSI is calculated using a mathematical formula that compares the magnitude of upward and downward movements over a specific period of time.
The indicator oscillates between 0 and 100, and a value above 70 is generally considered to indicate that an asset is overbought, which may imply a potential downward price reversal. On the other hand, a value below 30 indicates that an asset is oversold, suggesting a potential upward reversal.
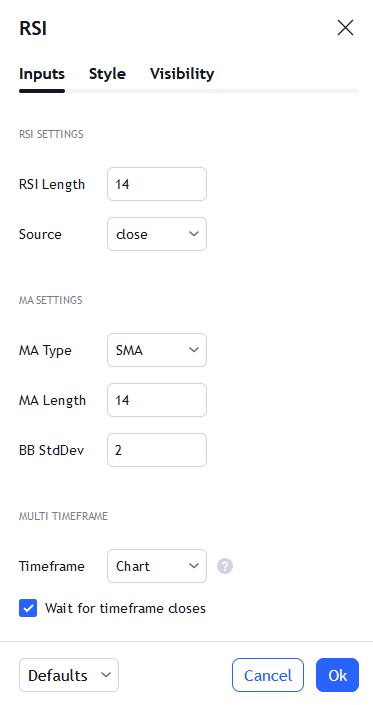
This is what its Settings window looks like.
TradingView RSI strategy script
We can start by manually recognizing our trading rules on the chart using lines to mark the points where our buy and sell operations should be executed, and then begin using Pine Script to plot the results on our chart.
We will select the Pine Editor tab at the bottom of our screen, which will open the editor for us to start writing our strategy.
By default, TradingView provides us with a script for indicators, but we will be writing/coding a strategy. To do this, in the top right corner of the editor, we will click on “Open” and select “Strategy” in the Templates section.
The example code shows rules for a moving average crossover strategy, but we will be using RSI. Therefore, we will start by renaming the script to “RSI Simple Strategy,” and even in the first line of code strategy(), we can assign it a short name. Then, we will delete e