
How To Calculate The Sharpe Ratio In Python For Your Trading Strategy
In this article, we will go through the Sharpe Ratio indicator, explain its meaning, its importance, and provide a practical example. In short, we show you how to calculate the Sharpe ratio in Python.
Related reading: –Algo trading strategies Python (Backtesting, Code, List, And Plenty of Coding Examples)
First, Let’s explain why volatility matters:
The volatility problem the Sharpe Ratio tries to solve
In any investment, it is important to evaluate the safety of your investment, because you want to preserve or grow your wealth.
In the chart below you see two simulated investments with 19.56% yearly return, the main difference is that investment 1 is safer.
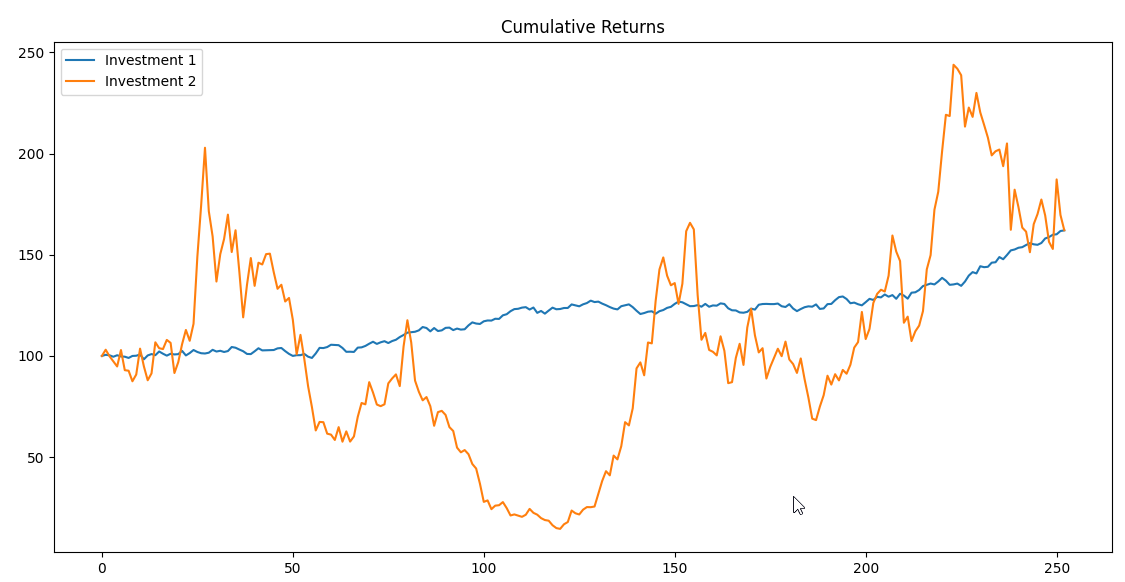
Why is number one safer?
It’s because the second investment has more ups and downs along the way. This is what we call volatility.
Imagine that on day 120, you need to withdraw capital from investment 2; this means that you will lose more than 80% of the initial value!
This is the essence of the concept of risk: the possibility that you can lose part or all of your investment. This is often referred to as sequence risk. Please read our take on sequence risk explained.
Think about this: if a financial instrument consistently makes a positive return every day, that instrument does not have any market risk, because every day you will know that the market value of that instrument is higher than the previous day.
Let’s suppose that you are hired to manage a $100 million portfolio, and around day 120, you need to write a report regarding the performance of the portfolio (see chart Investment 1). Perhaps you’ll be fired because of poor performance, but more likely is that investors will flee from your fun.
This implies that an investor needs to consider not only the total return from an investment but also its volatility.
What is the Sharpe Ratio?
There are two important parts in the formula: the first is excess return and the other is volatility. Let’s break down the indicator into an equation:

The excess return measures your investment over the risk free rate (), meanwhile the volatility is estimated as the standard deviation from the portfolio. Do not worry if you do not understand the Sharpe Ratio; we will explain it in more detail later on.
Calculating the Sharpe Ratio for S&P 500 and Russell 2000
Now is the moment to estimate the Sharpe Ratio and Total return for the Standard and Poor’s 500 (SPY 500) and the Russell 2000. We will use the SPDR S&P 500 ETF (SPY) as a proxy for the S&P 500 and the iShares Russell 2000 ETF (IWM) as a proxy for Russell 2000.
The Standard and Poor’s 500 is an index that tracks the performance of the biggest 500 companies in the United States, weighted by market capitalization. The Russell 2000 is an index that contains the 2000 smallest securities from the largest 3000 largest companies in the U.S stock market.
The Python code for the Sharpe Ratio
The first step is to import the Python libraries:

The second step is to set the risk-free rate, which in this article will be 3%:
