A Python Williams %R Trading Strategy (Backtest)
Introduction
This tutorial will use Python to implement a profitable trading strategy using the Williams %R indicator. The first part will explain the indicator, and the second part will implement the Python code.
The second goal is to illustrate how to improve the strategy by adding a second indicator in Python. In pursuit of this aim, this tutorial will put in place the Williams %R strategy and then add the RSI to improve it. However, please keep in mind that the main purpose is to show the Python code, not the strategy itself.
The last goal is to explain the* args and **kwargs arguments in Python functions.
Williams %R Indicator
The Williams %R Indicator is a momentum indicator that tries to find the entry and exit points in a trade. This indicator can be between 0 and -100. A value from 0 to 20 means it is overbought, while -80 to -100 means it is oversold. Larry Williams developed the indicator to measure the connection between the closing price and the highest high and lowest low in a look-back period.
The calculation is:
\%R = -100\left(\frac{{\text{{Highest High}} - \text{{Close}}}}{{\text{{Highest High}} - \text{{Lowest Low}}}}\right) Lowest Low: lowest low for the look-back period
Highest High: highest high for the look-back period
Close: closing price
%R: Williams %R indicator
The Williams %R indicator is also covered in our study called Which Is The Best Indicator For Swing Trading?
Data
This tutorial will use the Vanguard Total Intl Stock Idx Fund (VXUS) ETF. The period of study is from the year 2011 to the year 2023.
Python Implementation
The first step is to import the Python libraries and download the historical data:
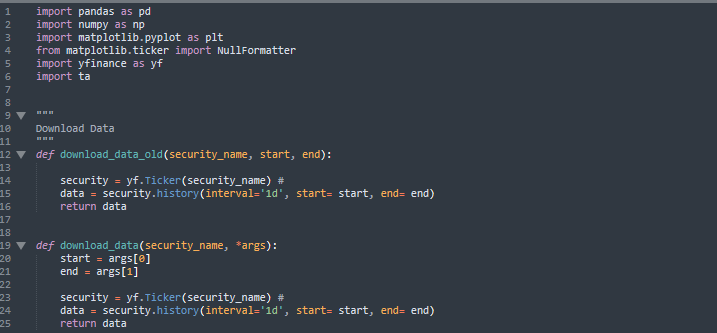
The above image shows two functions: download_data and download_data_old. They both download data from Yahoo Finance.
The download_data function has two parameters: security_name and *args; meanwhile, the download_data_old function has three parameters: security_name, start, and end.
The main difference between the implementations is the term “*args“. This term means there is no limit to the number of parameters to add. In the download_data function body, image args[0] and args[1] are the first and second arguments of *args, which are start and end, respectively.
The implementation and output of the download_data function is:
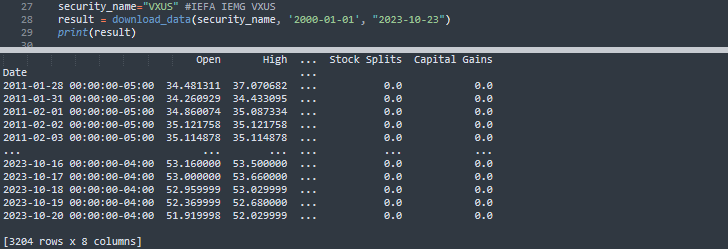
Although, the start date to request data is the year 2000. The first date in the dataset is “2011-01-28”. This is because its inception date was 2011-01-26.
Williams %R and RSI Indicators Plots
This section will use the ta Python package to calculate the Williams %R and the RSI indicators. Next, it will construct the plot_data function to plot the closing price and both indicators.
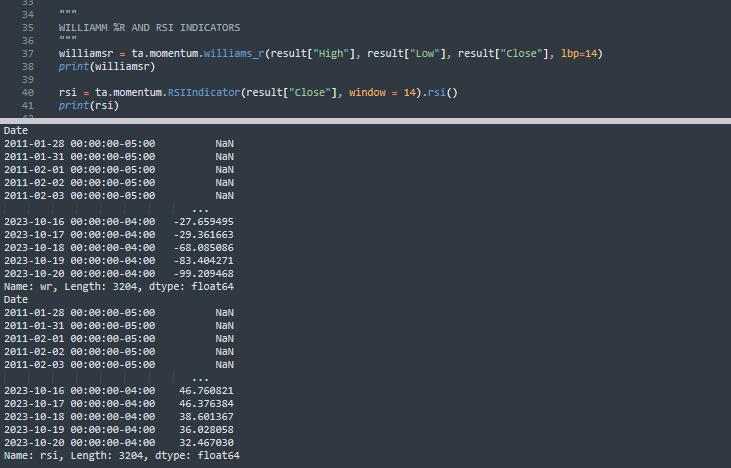
The following image shows the ta.momentum.williams_r function. It calculates the Williams %R indicator. This function has four parameters high, low, close, and lbp; the term lbp is the look-back window.
The ta.momentum.RSIIndicator function calculates the RSI using close price and window (look-back) as parameters. The Python commands print(williamsr) and print(rsi) show the outputs.
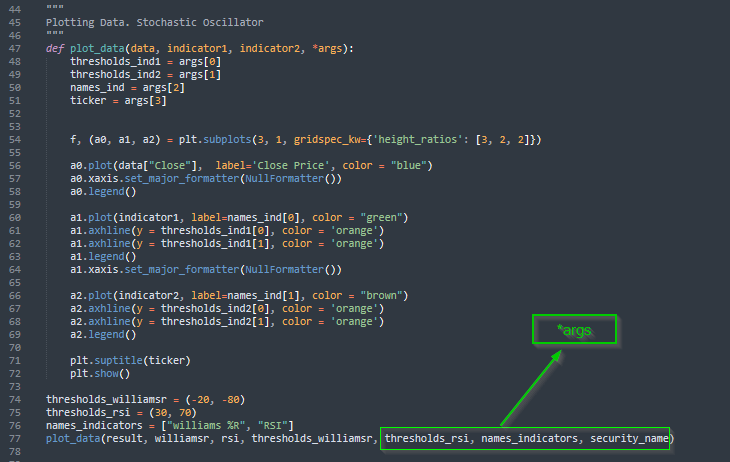
The plot_data function displays three charts: the closing price at the top, the Williams %R indicator in the middle, and the RSI indicator at the bottom. The function has four parameters: data, indicator1, indicator2, and *args. The *args input has four parameters.
The first parameter in *args is a tuple with the Williams %R thresholds. The second parameter is a list with the RSI thresholds. The third parameter is a list with the name of the indicators.
The last parameter is a string with the financial instrument name. To divide the plot into three subplots, use the f, (a0, a1, a2) = plt.subplots(3, 1, gridspec_kw={‘height_ratios’: [3, 2, 2]}) command.
The subplots will be arranged in one column, with one above the other (three rows and one column). The a0, a1, and a2 indicates the first, second, and third plot respectively.