
Reversal Trading Strategy in S&P 500 Performance Analysis (Rules, Setup, Backtest, Performance)
Mondays and Fridays often turn out to be reversals when they move hard either way. Let’s look at a specific reversal trading strategy in S&P 500:
Today, we look at an S&P 500 reversal trading strategy that happens on Mondays and has generated 0.77% per trade.
Let’s go straight to the trading rules:
A reversal trading strategy in the S&P 500 – trading rules
The trading rules can be
- Today is Monday.
- Yesterday (Friday) was down more than -0.15% and today also more than -0.15% (from close to close).
- If 1-2 are true, then go long at the close.
- Exit at the close on Friday or earlier if the close is higher than yesterday’s close.
The strategy is often referred to as the Turnaround Tuesday strategy, but the trading rules above are a twist to the strategy.
S&P reversal backtest
Let’s backtest in Amibroker the trading rules listed above.
We get the following equity curve for S&P 500 (we use the ETF with the ticker code SPY):
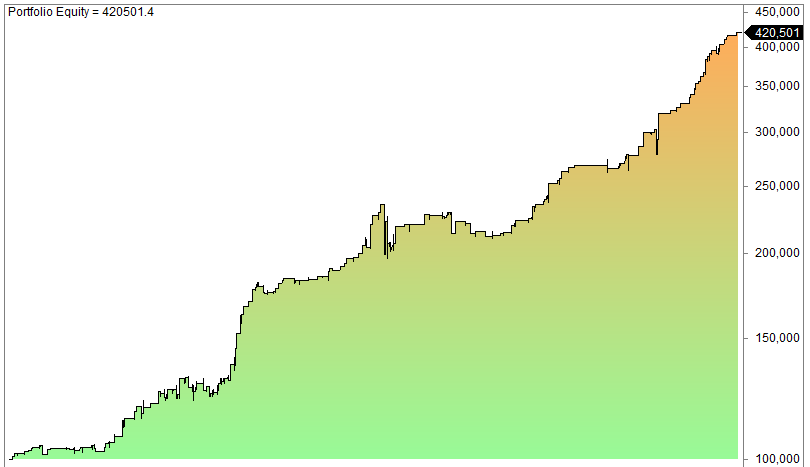
There are 195 trades and the average gain per trade is 0.77%. That equals 4.8% annual returns. This might not set the world on fire, but keep in mind that you are only invested 6.5% of the time. Thus, the strategy might be better as a futures strategy (@ES).
What is the best way to trade reversals?
There is no best or worst in trading. But we have one clear recommendation: backtest. If you have a trading idea, formulate it into trading rules and backtest it. If it performs well, put it into a demo account for a year and see how it performs on unknown data. If still good, then you might consider trading it for a small amount of money.
What is an S&P 500 trend reversal strategy?
An S&P 500 trend reversal strategy is a trading strategy that aims to profit from changes in the direction of the S&P 500 index.
Trend reversal strategies can be used to go long (buy) the S&P 500 when it is expected to reverse from a downtrend to an uptrend, or to go short (sell) the S&P 500 when it is expected to reverse from an uptrend to a downtrend.
However, the definition of trend is up to you and depends on the time frame. This is why you need to backtest!
Which markets are best for reversals?
The same answer as above applies here as well. Backtesting often give you the answer you are looking for.
That said, we believe the stock market offers the best odds for making good reversal strategies.
Which indicators are best for S&P 500 reversal strategy?
In an earlier article, we backtested and ranked the best trading indicators.
What are some common S&P 500 trend reversal signals?
Some common S&P 500 trend reversal signals include:
- Technical indicators: Please see the linked article in the previous FAQ. Indicators can be very useful because you are forced to quantify.
- Price action: Price action is the study of how the price of a security moves over time. Trend reversal traders often look for specific price patterns. Candlesticks are price action patterns.
What are some of the challenges of trading S&P 500 trend reversals?
Trading S&P 500 trend reversals is challenging – just like all trading. Let’s list a few reasons why:
- Trend reversals can be difficult to identify: It is not always easy to identify when a trend reversal is about to happen. This is why you need to backtest to know the historical hit rate and expected profits (or losses).
- Trend reversals can be short-lived: Trend reversals can be short-lived, meaning that they can quickly reverse back to the original trend. This can make it difficult to profit from trend reversals.
- Trend reversals can be volatile: Trend reversals can be volatile, meaning that they can be accompanied by large price swings. This can make it difficult to manage risk and protect your profits.
- Trend reversals can be psychologically tricky. Why? Because you are buying when there is blood in the streets, and selling when there is euphoria. This requires contrarian thinking and is very hard for must of us.
Is there a guarantee that I will make money trading S&P 500 trend reversals?
Of course not!
There is no guarantee that you will make money trading S&P 500 trend reversals. Trend reversal trading is a risky activity, and there is always the possibility of losing money. If you are using leverage, you can lose a LOT of money.
FAQ:
– What is an S&P 500 trend reversal strategy?
An S&P 500 trend reversal strategy aims to profit from changes in the direction of the S&P 500 index. It can involve going long when anticipating a reversal from a downtrend to an uptrend or going short when expecting a reversal from an uptrend to a downtrend. The definition of a trend depends on your chosen time frame.
– How does the S&P 500 reversal strategy perform on Mondays?
The strategy has generated an average gain of 0.77% per trade, with a total of 195 trades. This translates to approximately 4.8% annual returns, considering that the strategy is only invested 6.5% of the time.
– Which markets are best for trading reversals?
The effectiveness of reversal strategies can vary across markets. It’s advisable to backtest strategies in different markets to determine where they perform best. However, stocks are often considered favorable for making effective reversal strategies.
Hi,
Here’s a small script that replicates your strategy in R (http://www.r-project.org):
install.packages(c(“quantmod”, “lubridate”))
library(quantmod)
library(lubridate)
posSize <- 5000 # per trade
txnFees <- 0.02 # per share
# Get data from Yahoo Finance
x <- getSymbols("SPY", from = "2005-01-01", auto.assign = FALSE)
# Adjust OHLC and subset data from 2005-01-01 to 2013-02-28
x <- adjustOHLC(x["2005::2013-02"], use.Adjusted = TRUE)
# Signal: if Friday and last two close to close were down
x$Wday <- wday(index(x))
x$Sig <- ifelse(x$Wday == 6 & Cl(x) < Lag(Cl(x)) & Lag(Cl(x)) < Lag(Cl(x), 2), 1, 0)
# Entry price: close price of sig day
x$EntryPrice <- as.numeric(Cl(x))
# Exit price: close price 2 days later
x$ExitPrice <- c(as.numeric(Cl(x))[-c(1:2)], rep(NA, 2))
# Number of shares
x$Shares <- floor(posSize/x$EntryPrice)
# Calculate PnL including txn fees
x$PnL <- x$Sig * x$Shares * (x$ExitPrice – x$EntryPrice – 2 * txnFees)
x[is.na(x)] <- 0
plot(cumsum(x$PnL/posSize))