Sell in May and Go Away: A Myth or a Fact in Stock Trading?
Sell in May – myth or fact?
Sell in May and go away must be one of the most famous phrases in the stock market. But is this adage a myth or a fact? Is sell in May and go away true? Plenty of myths in the stock market have never been backtested properly. There is a lot of academic empirical evidence showing this anomaly has existed for many decades, both in the USA and elsewhere, but we like to test ourselves.
Perhaps surprisingly, the phrase is spot on. It turns out sell in May and go away (stocks) makes sense, at least how we backtested it. The period from May until October is a seasonally very weak period for the S&P 500. May itself is not such a bad month, but the summer doldrums until the end of September have been weak for over 60 years.
Does this mean you should sell your stocks in May?
If you are a long-term buy-and-hold investor – no. Then you keep your stocks and forget about it.
However, if you are a short-term trader, you might exploit many of the seasonalities in the stock market.
Let’s start: What is the Sell in May and go away strategy?
Sell in May and go away history (stocks)
Is this just a myth, or is it correct? Let’s find out by looking at the historical numbers:
My data is the S&P 500 index from 1960, downloaded from Yahoo/finance. The index doesn’t include dividends and is thus excluding a vital part of the performance. It’s a cash index. However, the dividends are distributed throughout the whole year and shouldn’t distort the results so much (comparatively).
Let’s start by looking at the performance monthly from one monthly close to another:
| Month | Avg. Profit% | Win-ratio % | Profit factor | Max loss % |
| January | 1.18 | 59 | 1.64 | -8.6 |
| February | 0.04 | 55.7 | 0.98 | -10.9 |
| March | 0.89 | 62.3 | 1.7 | -12.5 |
| April | 1.52 | 72.1 | 1.37 | -9 |
| May | 0.09 | 57.4 | 1.01 | -8.6 |
| June | -0.07 | 53.3 | 0.9 | -8.6 |
| July | 0.63 | 50 | 1.45 | -7.9 |
| August | 0.15 | 58.3 | 1.02 | -14.6 |
| September | -0.55 | 45 | 0.66 | -11.9 |
| October | 0.95 | 61.7 | 1.45 | -21.8 |
| November | 1.42 | 68.3 | 2.2 | -11.4 |
| December | 1.31 | 73.3 | 2.6 | -9.2 |
The profit factor is defined as the gross profit divided by the gross loss (including commissions) for the entire trading period. As a rule of thumb, I like this number to be above two as a stand-alone trading system.
The table shows that May is not a good month, but it still has three months that have performed worse. For some reason, September has been the worst month. Unfortunately, I can’t come up with any rational explanation for why some months are worse than others.
The numbers tell us that the period from October to the end of April is by far the best period, and opposite, the period from April until October seems to be the worst.
The sell in May and go away seasonality – backtest
We test the following on S&P 500 (the cash index, no dividends reinvested) from 1960 until today:
- Buy the open on the first day of May, sell the open on the first day in October, versus
- Buy the open on the first day of October, and sell the open on the first day in May.
Our time periods are not equal. We chose to exit in October instead of November because we know the 4th quarter is the best quarter historically.
Buying the open in May and selling the open in October gives this accumulated chart:
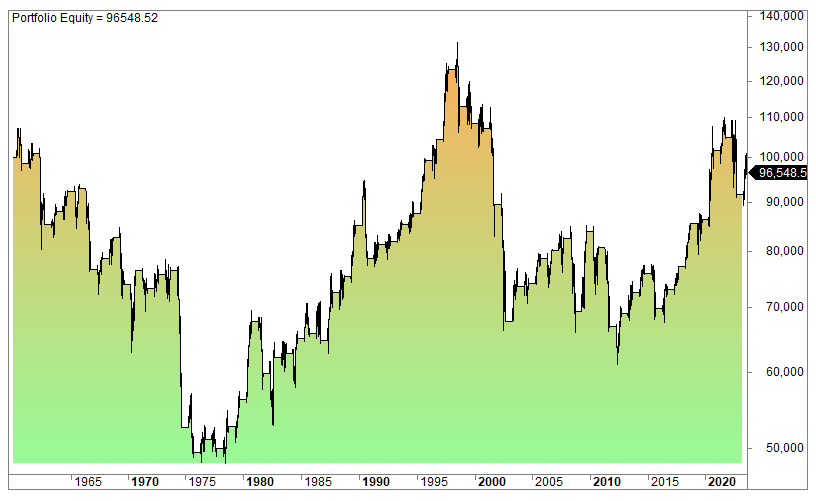
As we can see, it’s more or less a flat return! The annual return of this strategy is a negative 0.06%! Quite remarkably, you practically have no profits after 60 years of being invested from May until September!
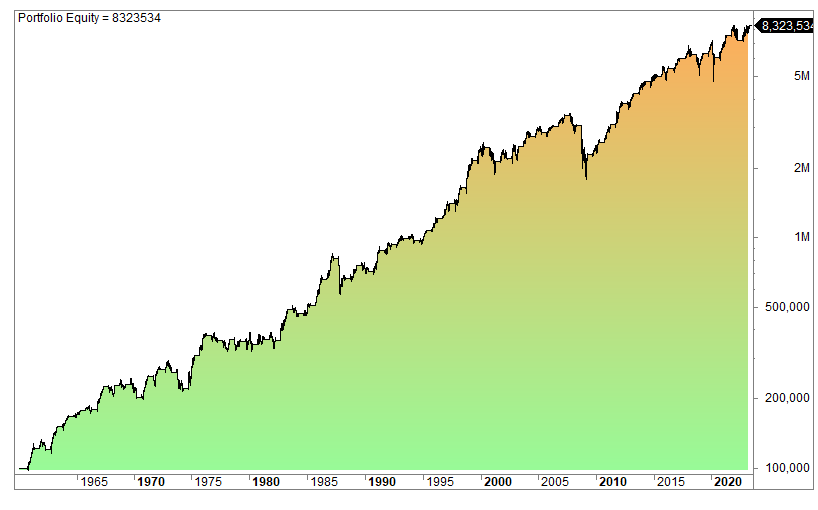
Opposite, buying the open in October and selling the open in May gives this accumulated chart: