
Trend Following Strategy in S&P 500: (Meb Faber and Paul Tudor Jones)
Trend following the S&P 500 is probably not the sexiest thing to do. Back in 2012 Meb Faber published a paper called A Quantitative Approach To Tactical Asset Allocation in the Journal of Wealth Management. Meb Faber found the 200-day moving average useful and decided to look at the following simple trend following system in the S&P 500 based on the 200-day moving average:
Go long the S&P 500 when the price crosses the 200-day moving average, and sell when it crosses below the 200-day average. This is probably not the most sensational strategy, to say the least. However, Faber’s article is a great read because of his “simple” ideas, yet very powerful.
This strategy is so simple that it’s easy to dismiss. We have dismissed it many times, and we have not looked at the strategy for about 7-8 years. The temptation to develop more powerful and complex strategies is always lurking in the back of any trader’s head.
Why is the 200-day moving average useful?
The strategy is a so-called trend-following strategy that only looks at the price and nothing else. The strategy doesn’t care about news, earnings, valuations, sentiment, interest rates, and so on. The only focus is what the market is doing, not what it’s supposed to be doing. It can’t get any simpler than that (a simple algorithm).
First, the principle of using a simple moving average as a trend filter is extremely easy and simple. Meb Faber’s 200-day moving average strategy is so simple anyone can grasp the idea after 5 seconds, even non-traders and investors.
One trader legend, Paul Tudor Jones, once said this about the 200-day moving average in an interview with the author Michel Covel:
My metric for everything I look at is the 200-day moving average of closing prices. I’ve seen too many things go to zero, stocks and commodities. The whole trick in investing is: “How do I keep from losing everything?” If you use the 200-day moving average rule, then you get out. You play defense, and you get out.
It turns out that Paul Tudor Jones is right about the 200-day moving average. It keeps you out of trouble and avoids many nasty drawdowns. We assume that Paul Tudor Jones trading strategy is a bit more sophisticated than just this filter, but it shows that even the simplest things can contribute. However, Paul Tudor Jones is no particular fan of trend following as he believes markets most of the time don’t trend.
We have made a video about Paul Tudor Jones, and you can find the 200-day moving average explained in the video:
But the question is: does this trading system also mean you forego profits – in the long run?
Let’s test and find out:
Trend following the S&P 500 using daily data
Let’s start our test and see how a 200-day moving average performs on the S&P 500 from 1960 until today:
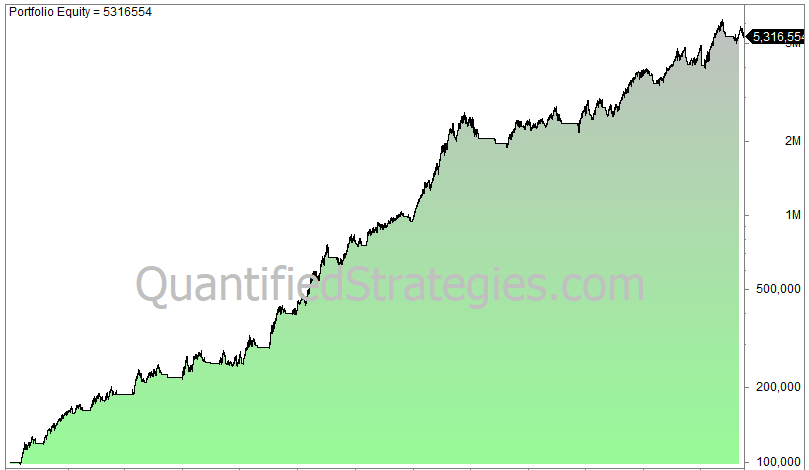
The trading rules are simple:
Trading Rules
[am4show have=’p2;p3;p58;p59;p130;p138;’ user_error=’Premium Post Access’ guest_error=’Premium Posts’]
We buy when the close is above the 200-day moving average, and sell when it crosses below. The logarithmic