
Using The Same Trading Strategy On All Indexes
If you have a potential trading strategy, which market are you going to backtest it on? And what do you do if it works on S&P 500 but not so well on Russell 2000?
This article uses the same trading strategy on four different US stock market indices to show the differences in returns and performance (depending on the stock index applied).
What is a stock market index, and what are the differences?
The S&P 500, Russell 1000, Russell 2000, and Russell 3000 are all stock market indices used to measure the performance of various segments of the U.S. stock market.
While they share some similarities, there are key differences between them in terms of the number of companies included and the size of the companies they represent.
Let’s look at the differences:
- S&P 500: The S&P 500, short for Standard & Poor’s 500, is a widely followed stock market index representing the performance of the 500 largest publicly traded companies in the United States. Companies are selected based on their market capitalization, liquidity, and industry representation. The S&P 500 is often used as a benchmark for the U.S. stock market and is considered a measure of large-cap stocks’ overall health and performance. It’s probably the most followed index in the world.
- Russell 1000: The Russell 1000 is an index that includes the largest 1000 companies in the U.S. equity market, based on market capitalization. It is a subset of the Russell 3000 index, which encompasses a broader range of companies. The Russell 1000 is typically used as a benchmark for large-cap stocks, as it represents the performance of the largest and most established companies in the U.S. market.
- Russell 2000: The Russell 2000 index focuses on smaller companies than the S&P 500 and Russell 1000. It includes approximately 2000 small-cap companies in the U.S. equity market. The selection of companies is based on market capitalization, with the Russell 2000 representing the bottom two-thirds of the Russell 3000 index in terms of market cap. The Russell 2000 is often used as a benchmark for small-cap stocks and is considered a measure of the performance of smaller, potentially higher-growth companies.
- Russell 3000: The Russell 3000 is a broad stock market index encompassing the largest 3000 publicly traded companies in the U.S. equity market. It is designed to comprehensively represent the U.S. stock market and includes companies of varying sizes, from large to small. The Russell 3000 is a benchmark for the overall U.S. equity market and is often used by investors and fund managers to evaluate their performance relative to the broader market.
In summary, the S&P 500 represents the largest 500 companies in the U.S., while the Russell 1000 includes the largest 1,000 companies, and the Russell 2000 focuses on smaller-cap companies. The Russell 3000 is the broadest index, encompassing 3,000 companies of varying sizes. Each index serves as a benchmark for different segments of the U.S. stock market.
What are the differences in terms of CAGR, exposure, maximum drawdown, etc., when the same strategy is applied to different stock universes? Let’s find out!
Strategy explained
We’re focusing on the same strategy we used in earlier articles:
- When To Sell? Unveiling the Best Trade Exits: Backtest Comparisons
- Unveiling the Best Trade Entries: Backtest Comparison Reveals Surprising Results!
- Weekly Mean Reversion System For S&P 500 Stocks
It’s a simple mean reversion strategy with solid results. The trading rules are as follows:
[am4show have=’p2;p3;p58;p59;p130;p138;’ user_error=’Premium Post Access’ guest_error=’Premium Posts’]
Buy rules:
- The stock needs to be part of the respective index:
- S&P 500
- Russell 3000
- Russell 1000
- Russell 2000
- 2-day RSI crosses below 10
- Entry on the next day open
- Stock price trading above 52-week moving average
- Position size: 10% each, the maximum number of simultaneous positions is 10
- If there are more signals than open slots, ranking based on the 52 weeks rate of change is applied
Sell rules:
- If the 2-day RSI crosses above 60, we sell at the next day’s open
Backtest settings:
- Time range: 2000-2022
- Data provider: Norgate Premium, survivorship-bias free
- Starting equity: $100000
- Commissions per trade: $2
[/am4show]
Strategy backtest and comparison
The base strategy, the one which focuses on the stocks being part of the S&P 500 index, won’t be discussed in detail as it was covered before in the linked articles above. With a CAGR of 17.8% and a maximum drawdown of -30.5%, it is a solid strategy but nothing one should trade out of the box. If you’re interested in the metrics, see the article here. All key metrics are again listed in a table further below for simple comparison.
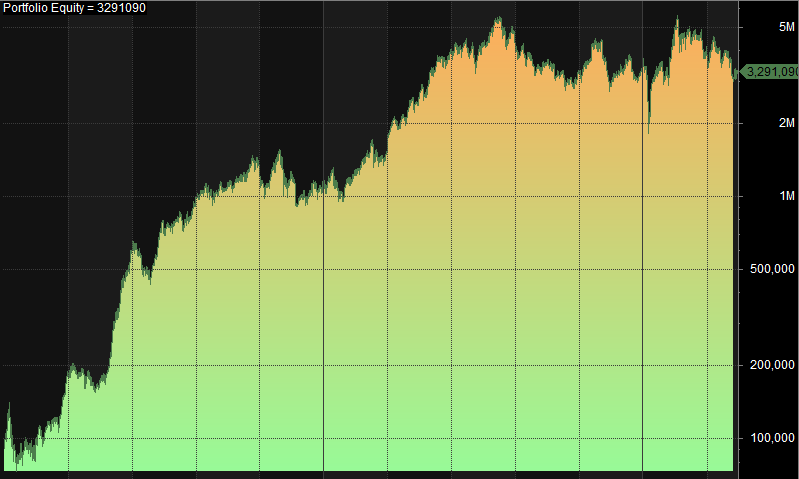
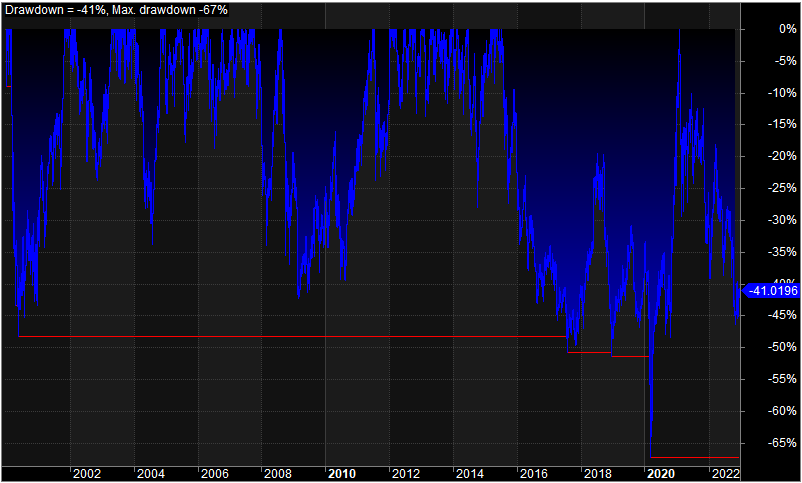
Increasing the stock universe from the 500 to the 3000 biggest publicly traded U.S. companies (Russell 3000) lowers the CAGR from 17.8% to 16.4%.
Comparing the number of trades, the strategy opens and closes more trades than before, thus increasing exposure. The equity curve is a bit more volatile, showing a severe drawdown in spring 2020 caused by the Corona pandemic. Although the strategy recovers afterward, it remains underwater by -41% by the end of 2022. Seeing the heavy drawdowns, one should think of a rule on how to mitigate the losses:
Applying the strategy to the 1000 largest U.S. companies, the Russell 1000 stocks, the metrics are again more solid:
The CAGR of 22.0% is even higher than the S&P 500 base strategy, and the maximum drawdown is way less than for the Russell 3000 strategy. The volatility of the former equity curve has vanished, resulting in a much more tradable version of this strategy.
Comparing the Russell 1000 and Russell 3000 metrics, we can see that the smaller companies of the index introduce volatility by not reverting to the mean after a massive selloff. It might be the case that oftentimes the strategy is caught in positions that keep crashing without any sign of recovery.
Therefore many positions are exited with a considerable loss, hurting the drawdown and lowering the average profit and loss significantly. If our assumption is correct, the metrics should improve when applying the strategy to the Russell 2000, the lower two-thirds of the Russell 3000. Let’s see.
Considering all Russell 2000 stocks, we have a CAGR of 13.9% and a maximum drawdown of 63.3%. While the drawdown is slightly better than the Russell 3000 strategy, all of the other metrics are worse:
CAGR is lower, exposure is higher, risk-adjusted return is lower, the percentage of winners is lower, and average profit and loss is lower. This clearly indicates that smaller companies must be handled carefully in mean reversion strategies.
Here is a summary of the same strategy applied on different stock market indexes:
| S&P 500 | Russell 3000 | Russell 1000 | Russell 2000 | |
|---|---|---|---|---|
| CAGR [%] | 17.8 | 16.4 | 22.0 | 13.9 |
| Exposure [%] | 74.1 | 84.7 | 80.5 | 83.5 |
| RAR [%] | 24.1 | 19.4 | 27.4 | 16.6 |
| Number of trades [-] | 11895 | 12926 | 12731 | 12627 |
| Max. DD [%] | -30.5 | -67.3 | -38.0 | -63.3 |
| Winners [%] | 66.2 | 64.2 | 66.3 | 63.4 |
| Avrg. PnL [%] | 0.35 | 0.35 | 0.40 | 0.32 |
Conclusion
The same strategy was applied to four different stock universes. Expanding from the S&P 500 to the Russell 3000 reduces the CAGR, increases exposure, and results in a more volatile equity curve.
Applying the strategy to the Russell 1000 improves metrics, with a higher CAGR and lower drawdown. However, the smaller companies in the index introduce volatility and hinder the strategy’s performance. The Russell 2000 strategy shows lower metrics overall. This is perhaps to be expected, because smaller companies have smaller moats and more unproven business models.
In this case, with a simple ruleset, you could consider expanding the trading universe from the 500 to the 1000 largest U.S. companies. From our experience, you can’t expect a strategy to work well on all assets, and it must be tested for every strategy. This is not curve fitting.
Disclaimer
Quantified Strategies (SIA Lofjord) is not an investment advisor. The content and information provided are educational and should not be treated as financial advisory services or investment advice. Trading and investment in securities involve substantial risk of loss and is not recommended for anyone that is not a trained trader or investor – it shall be conducted at your own risk. It is recommended that you never risk more than you are willing to lose. Leverage can lead to substantial losses. Any use of leverage, margin, or shorting is at your discretion. Quantified Strategies (SIA Lofjord) is not responsible for any losses that occur as a result of its content and information.
Hypothetical or simulated performance results have certain limitations. Unlike an actual performance record, simulated results do not represent actual trading. Also, Since the trades have not been executed, the results may have under or overcompensated for the impact, if any, of certain market factors, such as lack of liquidity. Simulated trading programs, in general, are also subject to the fact that they are designed with the benefit of hindsight. No representations are made that any account will or is likely to achieve profit or losses similar to those shown.
FAQ:
How does the Russell 1000 differ from the Russell 2000?
The Russell 1000 is an index comprising the largest 1000 companies in the U.S. equity market, focusing on large-cap stocks. In contrast, the Russell 2000 index includes around 2000 small-cap companies, representing the lower two-thirds of the Russell 3000. The key difference lies in the size and market capitalization of the included companies.
What is the significance of CAGR in the context of trading strategies?
CAGR, or Compound Annual Growth Rate, is a metric that provides a smoothed annual rate of growth for an investment over a specified time period. In trading strategies, CAGR indicates the average annual growth rate of an investment. It helps assess the strategy’s performance by considering the compounding effect over time.
Can you explain the backtest settings used in the provided trading strategy?
The backtest settings include a time range from 2000 to 2022, data from Norgate Premium, starting equity of $100,000, and $2 commissions per trade. These settings are crucial for evaluating the strategy’s historical performance and understanding how it would have performed under specific conditions.