

Cutler’s RSI Trading Strategy (Indicator Backtest And Example)
Cutler’s RSI including backtest
The RSI is a very popular trading indicator among different security traders. But there are other variations of the RSI indicator. One of them is Cutler‘s RSI. You may be wondering what it is, and in this article, we provide you with a description and how it performs in backtests.
Cutler’s RSI is a variation of the original RSI indicator developed by Welles Wilder. It uses a simple moving average in its calculation instead of the smoothed moving average used in Wilder’s original RSI formula. Because it uses a simple moving average, Cutler’s RSI is not data length dependent, so it returns consistent results regardless of the length of the period, or the starting point. However, our backtests reveal that Cutler’s RSI is no improvement compared to Wilder’s RSI.
What is Cutler’s RSI indicator?
Cutlers’ RSI is a variation of the original RSI developed by Welles Wilder. This variation of the RSI uses a simple moving average instead of an exponential average Wilder used in his original formula. As with the original RSI, Cutler’s RSI is based on the ratio of the average upward change during trading sessions that closed higher to the average downward change during sessions that closed lower.
Cutler had found that since Wilder used a smoothed moving average to calculate RSI, the value of Wilder’s RSI depended upon where in the data file his calculations started. He termed this Data Length Dependency. By using the simple moving average instead of the exponential or smoothed moving average used in Wilder’s original formula, Cutler’s RSI is not data length dependent, and as such, it returns consistent results regardless of the length of, or the starting point within, a data file.
Apart from the minor differences in the calculation, Cutler’s RSI is also used as a momentum oscillator in technical analysis to measure the speed of price movements. Just like the original RSI, it oscillates between zero and 100, and traders use the readings to gauge the momentum of price movements.
When attached to the chart, the indicator is usually displayed in the indicator box under the price chart, and the indicator line moves between the 0 and 100 readings. A reading of 30 or lower signifies an oversold market, while a reading of 70 and above signifies an overbought market. The indicator can also show divergence from the price movements when the price movement and the indicator movement are not synchronized.

Cutler’s RSI also deviates from Connors RSI. To show you the differences we have compiled all three versions of the RSI in one chart:
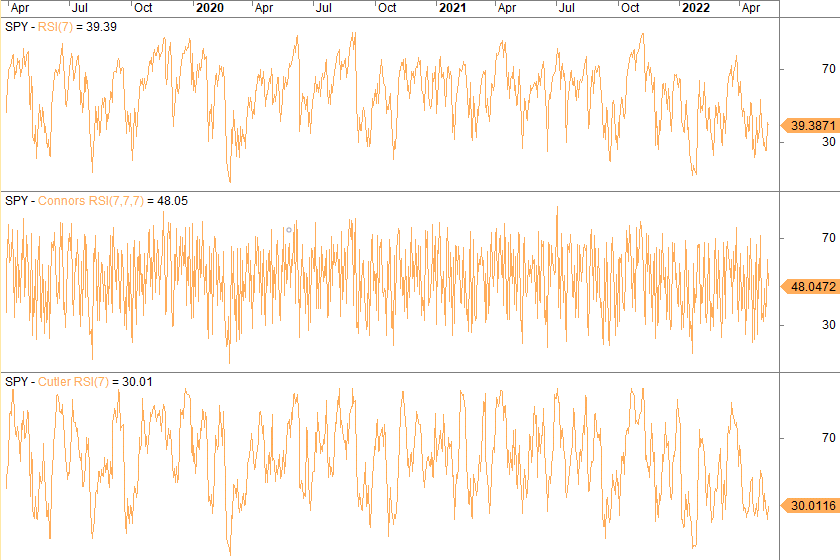
In the chart above all RSIs have a seven-day lookback period. And as you can see, they all deviate pretty significantly from each other.
What is the formula for Cutlers RSI?
The RSI is computed with a two-part calculation that starts with the following formula:
Part 1: Cutler’s RS = SMA (U, n)/SMA (D, n)
Where:
RS = relative strength factor
SMA (U, n) = n-period simple moving average of U, and U = upward change on days the market c