
Decoding the Post-Holiday Effect in Stocks: Patterns and Analysis
We have in a previous article determined that there is a positive holiday effect in stocks. This effect happens on the days before the holiday. But is there an opposite effect? Is there a post-holiday effect in the stock market?
What is a holiday?
First, we need to define what a holiday is:
To make it simple we only look at trading days after three non-trading days. In practice, this means we are looking at days around the 1st of January, Martin Luther King Day, George Washington Day, Good Friday, Memorial Day, 4th of July (not every year), Labor Day, and Christmas (not every year).
How do we backtest the post-holiday effect?
We test the S&P 500 by using the ETF with ticker code SPY from inception in 1993 until today. We both buy and sell the close of the same day as the signal.
We use Amibroker’s optimization function and test be exiting by holding 1-5 days.
Post-holiday effect test no. 1:
[am4show have=’p2;p3;p58;p59;p130;p138;’ user_error=’Premium Post Access’ guest_error=’Premium Posts’]
In the first test, we buy the close before the holiday and sell on the close N bars later (max five days later):

The first column shows when we exit the trade. The first row is one day and until the 5-day holding period. As you can see, holding over the holiday has produced no gains while the second day after the holiday has produced pretty good returns.
[/am4show]
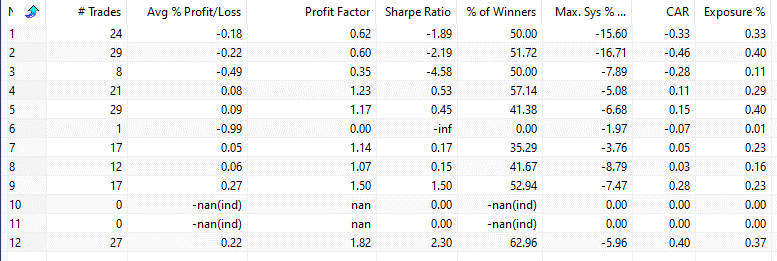
Let’s test and divide by months. The table below shows the different months (first column) and the performance by holding one day:
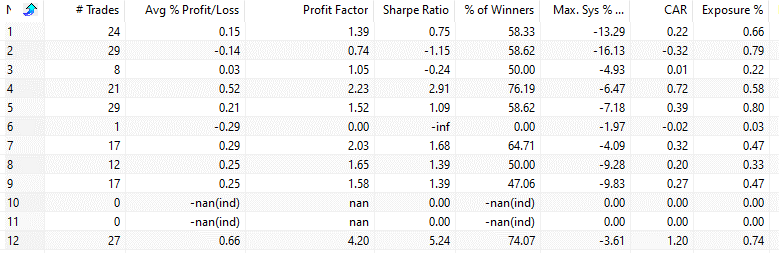
The table below shows the different months (first column) and the performance by holding two days:
Post-holiday effect test no. 2:
[am4show have=’p2;p3;p58;p59;p130;p138;’ user_error=’Premium Post Access’ guest_error=’Premium Posts’]
Let’s buy on the close of the first day after the holiday and hold for N bars:

The first column shows which bar we sell on. As we saw in the first test, the second day after the holiday is best with a profit factor of almost 2.
[/am4show]
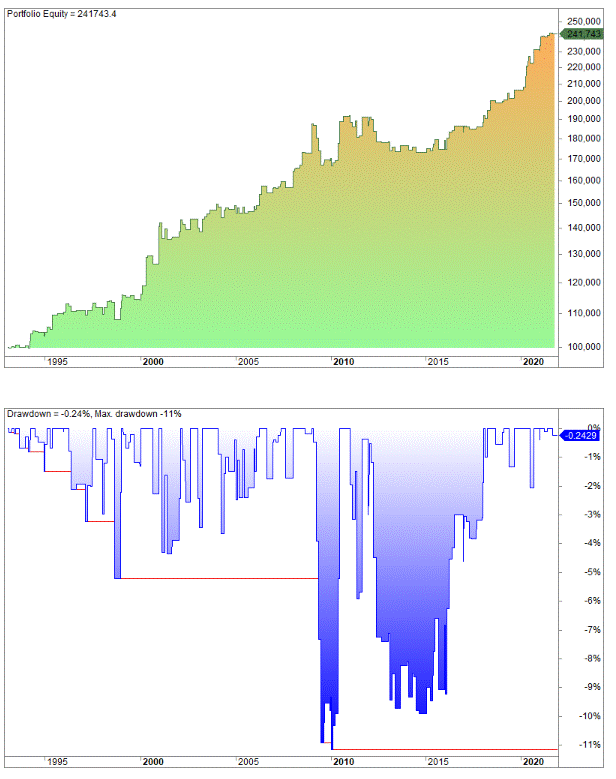
The equity curve looks like this:
If we divide into the different months it looks like this:
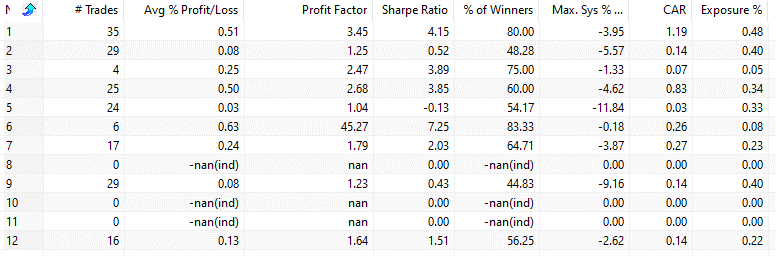
Martin Luther King Day in January, Good Friday, and the 4th of July are the best months.
Options expiration week
Some of the holidays often end in an options expiration week, while others are after options expiration week. Hence, the performance during holidays might also be dependent on that.
Post-holiday trading strategy:
Is it possible to develop a trading strategy based on this?
Yes, by adding one more variable we get this equity curve by holding from the close to the next day’s close:
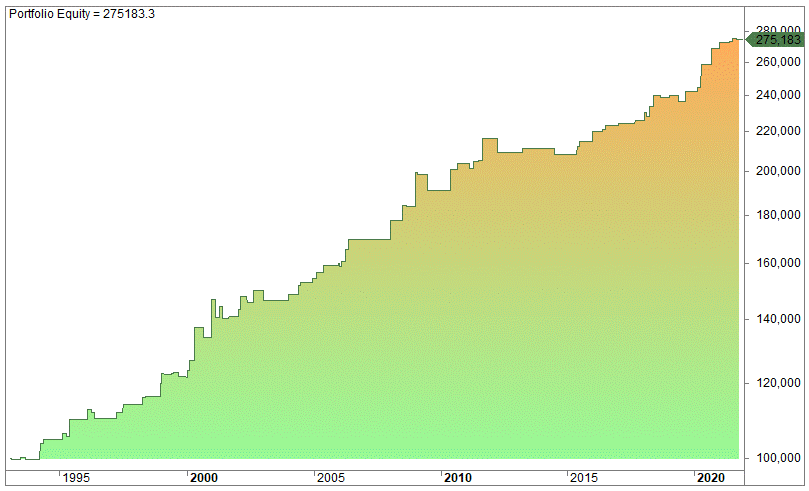
There are just 100 trades over the period, but the average gain is 0.56%, the win ratio is 71% and the profit factor is 4. This is a seasonal trading strategy and trades on a certain date plus one other variable – two variables in total. The annual return is 3.5% while only being invested 1% of the time. Another key performance metric is risk-adjusted returns and this shows about 250%.
The trading edge will be presented as a monthly edge for our subscribers:
If you’d like to have the Amibroker code for how to code these specific days, you can order it here and at the same time get access to the code for practically all our 80+ free ideas and strategies we have presented among our free trading strategies (plus a lot of Tradestation code):