Unveiling the Best Trade Entries: Backtest Findings
In this article, we make a backtest of a specific trading strategy and compare the results by using three different entries:
- Entry at the close the same day;
- Entry at the open the next day, or
- Entry by limit order the next day.
Let’s start:
Entry types
Let’s look at the different options for when and how to enter a position:
1. Entry on the next day open
Depending on when the buy or sell signal is being generated, one can think of different entries.
If the buy signal is generated at the close of the stock market, the most common entry, since it is the best one for part-time traders in terms of “sufficient time to place orders without any coding skills”, is the entry on the next day open.
After the stock market closes for the day, you have enough time to evaluate your new orders with the help of stock screeners, some manual selection methods, Python scripts, or any trading software. You can calculate the position size and, therefore the number of stocks to buy for each company can be done thoroughly without any pressure of time.
2. Entry on same day close
The first option to execute the buy signals is instantaneous with a market-on-close order or with a market order shortly before the stock market closes, e.g. 15 seconds before the closing bell.
This method requires some coding skills since you need to have trading software that automatically checks for the buy signals, evaluates how many positions there are already open and if there are some free slots to be filled, calculates the position size of each stock depending on the current equity and finally places the order.
All the mentioned steps need to be done within a couple of seconds. Moreover, you have to have a reliable system that executes your piece of software, for example, a cloud server or a server at home. For both entry methodologies which have been introduced, you can be sure that your orders get filled.
3. Entry next day with limit order
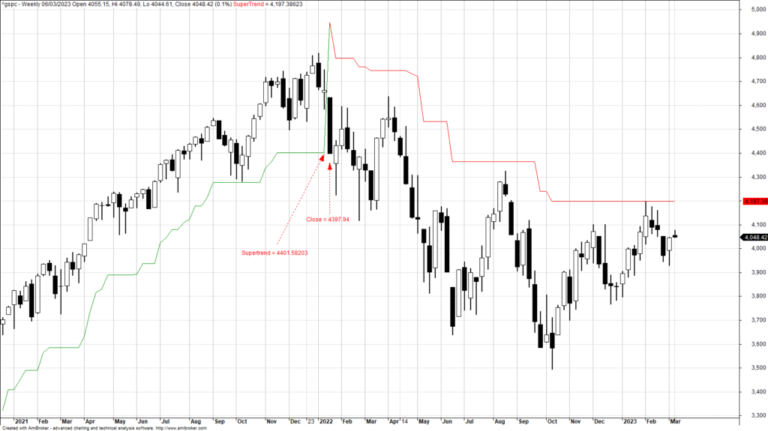
A third entry technique is trying to enter the trade, anticipating another short sell off. E.g., if the buy signal was generated on a Tuesday, we set limit orders for Wednesday a little bit below the closing price of Tuesday.
Again this requires some coding skills, not for the actual placement of the orders, but for the backtest itself. It has to be assured that no more positions will be opened as planned if the orders get filled. Usually, you set a limit between 5 and 15 positions simultaneously, depending on your risk profile.
Another drawback of this entry technique is that your live trading results can differ greatly since you try to enter with limit orders. There’s no guarantee that your limit orders get filled in live trading since it depends highly on liquidity.
The most important drawback with this type of entry, although we are backtesting very liquid stocks and quality data from Norgate, the backtest might overestimate (compared to live trading) the results based on two things:
- Our limit level might be part of “bad quote”, even though we have used Norgate
- Our limit level might have just a few shares traded, and we get a partial fill or nothing at all, even though this is very liquid S&P 500 stocks
The trading strategy explained
In the following, we do not want to focus on the strategy too much but on comparing the three mentioned entry types. Therefore the strategy is super simple and can be summarized as follows:
[am4show have=’p2;p3;p58;p59;p130;p138;’ user_error=’Premium Post Access’ guest_error=’Premium Posts’]
Trading rules for when to buy:
- The stock needs to be part of S&P 500 index
- 2-day RSI crosses below 10
- Stock price trading above 52-week moving average
- Position size: 10% each, the maximum number of simultaneous positions is 10
- If there are more signals than open slots, ranking based on the 52 weeks rate of change is applied
Entry variation:
- Entry on same day close
- Entry on the next day open
- Entry on the next day with limit order 2% below the last day close (make sure that only 10 slots are filled)
Trading rules for when to sell:
- If the 2-day RSI crosses above 60, we sell at the next day’s open (fixed for all three different entries)
Backtest settings:
- Time range: 2000-2022
- Data provider: Norgate Premium, survivorship-bias free
- Starting equity: $100000
- Commissions per trade: $2
Strategy backtest and comparison
Since the first entry technique is the most common one, we’ll treat it as our base strategy.
Entry at next day’s open backtest
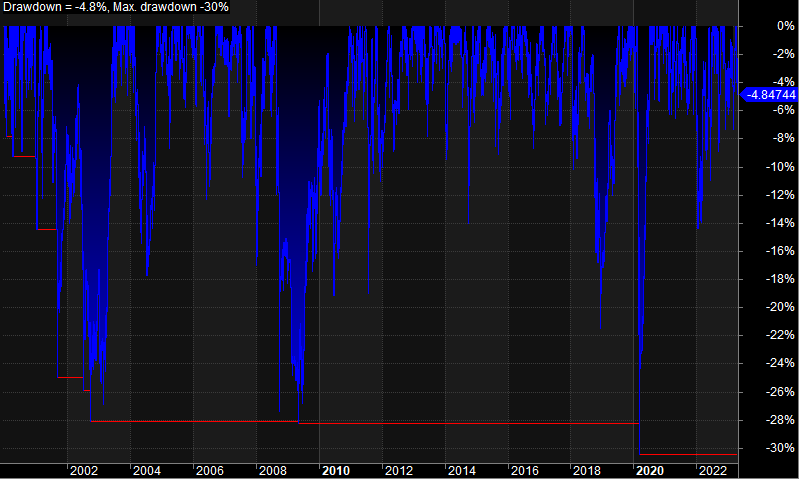
From 2000 till 2022, it offered a compounded annual growth return (CAGR) of 17.8 % with a maximum drawdown of 30.5 % while being invested 74.1 % of the time. The risk-adjusted return (RAR) is, therefore 24.1%.
The equity curve of the base strategy is relatively smooth; the drawdowns are distributed equally throughout the years, facing rougher times on three occasions.
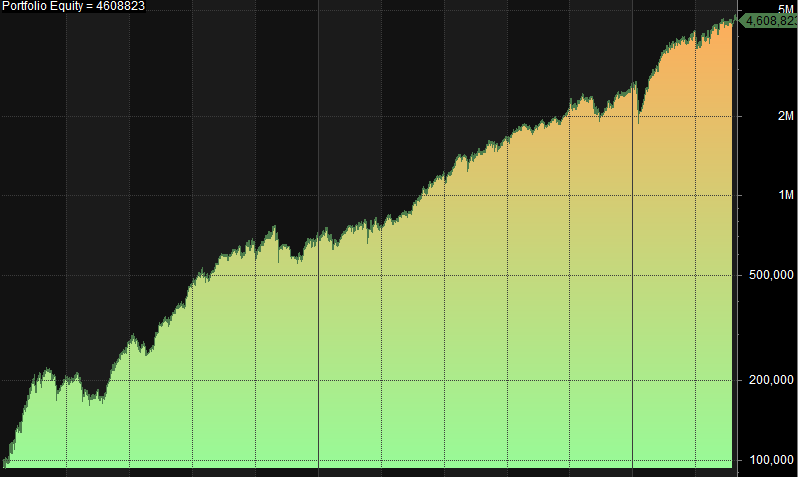
The metrics of the strategy are also listed in a table further below to make a comparison between the different entry techniques easier. But it can already be stated that the strategy offers a good edge despite being super simple!
Let’s see how the other entries are doing.
Entry at today’s close
With the second approach, we’re entering on the same day at the close. We already know from other strategies that holding the positions overnight can increase the performance significantly, especially after sell-offs, so let’s see if this holds for our strategy as well.
The CAGR jumps from 17.8 % to 24.4 %, exposure increases a little to 78.4 %, drawdown is decreased, and risk-adjusted return also increases. The average profit and loss per trade increases from 0.35 % to 0.52 %. Wow, these are some nice improvements for such a small change!
We do see fewer trades than before because we enter at close. Since already open trades are closed at the next day open, sometimes there might not be enough slots left for a new position. Exposure still rises since trades are being entered a day before.
Entry next day with limit order
What about the last entry technique?
We already know that the exposure and the number of trades will drop since we do not know if the limit orders will be filled. Therefore we do see an exposure of only 40% while the number of trades goes down to 5001.
But still, the annual return is at a decent level of 14.5 % with a risk-adjusted return of 36.6%. The average profit and loss number increases once more to 0.68 %!
What surprises us a bit is the higher drawdown of 32.3 %. Although the CAGR is much lower than for the second strategy, your risk drops significantly as you only invest 40 % of the time, something one cannot stress enough.
Let’s summarize our findings in a table:
| Entry on the next day open (base) | Entry on same day close | Entry with limit order on the next day | |
|---|---|---|---|
| CAGR [%] | 17.8 | 24.4 | 14.5 |
| Exposure [%] | 74.1 | 78.4 | 40.0 |
| RAR [%] | 24.1 | 31.1 | 36.3 |
| Number of trades [-] | 11895 | 10283 | 5001 |
| Max. DD [%] | -30.5 | -27.1 | -32.3 |
| Winners [%] | 66.2 | 67.9 | 65.43 |
| Avrg. PnL [%] | 0.35 | 0.52 | 0.68 |
[/am4show]
Conclusion
Three different entry techniques, and three different metrics.
Choosing one of the introduced methods initially depends on your coding skills. If you’re unable to do some programming or are unwilling to spend money for solid live trading software, stick to the first entry method (next day’s open).
The results are good, at least for this simple strategy. If you have some programming skills feel free to play with entry techniques no. 2 & 3. Selecting one of the options also depends on your risk profile, of course.
And one last remark, a similar analysis can be made for the exit signal. For the exit, one can think of two techniques, exit on the next day open, like in this analysis, or on the same day close. Feel free to test it!
The strategy is based on mean reversion. If you don’t know what this is, please read the section below:
What is a mean reversion system?
A mean reversion stock strategy is a trading approach that capitalizes on stocks that deviate from their long-term average prices.
The strategy aims to buy low and sell high by identifying undervalued stocks and profiting from their eventual price correction. Some typical indicators that traders use for a mean reversion strategy include:
- Moving Averages: The use of moving averages to identify the trend of an asset’s price and determine potential entry or exit points.
- Relative Strength Index (RSI): RSI is a momentum indicator that measures the strength of an asset’s price action. A low RSI reading may indicate an asset is oversold and due for a rebound, while a high RSI reading may indicate an asset is overbought and due for a correction. Most traders already know this indicator.
- Bollinger Bands: Bollinger Bands are a technical analysis tool that can help identify potential overbought or oversold conditions in an asset’s price. When the price of an asset moves outside of the upper or lower band, it may be a signal that the asset is overbought or oversold, respectively.
- Mean Reversion Oscillator: This oscillator compares the current price of an asset to its moving average, and produces a reading that indicates whether the asset is overbought or oversold relative to its historical average.
- Stochastic Oscillator: A stochastic oscillator is a momentum indicator that measures the relationship between an asset’s closing price and its price range over a specific period of time. It can be used to identify potential overbought or oversold conditions in an asset’s price.
Disclaimer
Quantified Strategies (SIA Lofjord) is not an investment advisor. The content and information provided are educational and should not be treated as financial advisory services or investment advice. Trading and investment in securities involve substantial risk of loss and is not recommended for anyone that is not a trained trader or investor – it shall be conducted at your own risk. It is recommended that you never risk more than you are willing to lose. Leverage can lead to substantial losses. Any use of leverage, margin, or shorting is at your discretion. Quantified Strategies (SIA Lofjord) is not responsible for any losses that occur as a result of its content and information.
Hypothetical or simulated performance results have certain limitations. Unlike an actual performance record, simulated results do not represent actual trading. Also, Since the trades have not been executed, the results may have under or overcompensated for the impact, if any, of certain market factors, such as lack of liquidity. Simulated trading programs, in general, are also subject to the fact that they are designed with the benefit of hindsight. No representations are made that any account will or is likely to achieve profit or losses similar to those shown.
FAQ:
Why is the entry on the next day open considered the most common?
The entry on the next day open is highlighted as the most common entry method, especially for part-time traders, due to its user-friendly nature, providing sufficient time to place orders without coding skills. Entry at the next day open, entry at the same day close, and entry with a limit order on the next day. Each method has its advantages and considerations.
What coding skills are required for entry on the same day close?
Entry on the same day close requires coding skills to automate the process of checking buy signals, evaluating open positions, calculating position size, and placing orders within seconds. This method involves market-on-close or market orders.
What are the key trading rules for when to buy in the backtested strategy?
The strategy includes specific trading rules for buying, such as the stock being part of the S&P 500 index, 2-day RSI crossing below 10, stock price trading above the 52-week moving average, and more. Traders suposse to capitaliz on stocks deviating from their long-term average prices.