
Portfolio Of Strategies – Enhancing Your Trading (Adding a Strategy, Correlation, and Diversification)
Does your trading strategy complement your portfolio of strategies? That is the first thing you should address if you are considering adding more trading strategies.
Perhaps surprisingly, many strategies don’t complement each other because they are too similar and overlapping. Thus, you might end up adding more losing trades to your already winning trades.
How do you complement or add value to a portfolio? This article shows via some naive examples why this happens.
(Before we go on we’d like to mention that we have a backtesting course that covers all aspects of how to backtest.)
Trading strategies and diversification
If you are a short-term trader you need many strategies to make it worthwhile – you need a portfolio of strategies. Furthermore, you need uncorrelated strategies. The key to successful trading is to understand correlation in trading and understand how the strategies interact in both good and tough times.
The most difficult task as a trader, alongside finding new strategies, is finding strategies that work well together. Unfortunately, two strategies that work well on their own don’t necessarily translate into an improved “portfolio” of strategies for many different reasons.
We have written multiple times that the only holy grail in trading is to spend time developing strategies that complement each other. You can’t add ten mean-reverting strategies in stocks, for example, you need to have different types of strategies.
- Gap trading strategies
- Trend following strategies and systems explained
- How to create a mean reversion trading strategy
- Why is short selling difficult?
- Breakout trading strategies
Two mean-reverting strategies
Let’s make an example to easier illustrate what we mean. On our landing page of free trading strategies we have backtested several of Larry Connors’ trading strategies, taken from his book called High Probability ETF Trading, published in 2009.
Let’s pick two of Connors’ strategies:
How do these strategies perform together? Both strategies are tested on a basket of different ETFs:
DIA, EEM, EFA, EWH, EWJ, EWT, EWZ, FXI, GDX, GDXJ, GLD, ILF, IWM, IYR, QQQ, SPY, TLT, XHB, XLP, XLE, XLF, XLI, XLP, XLV, AND XME.
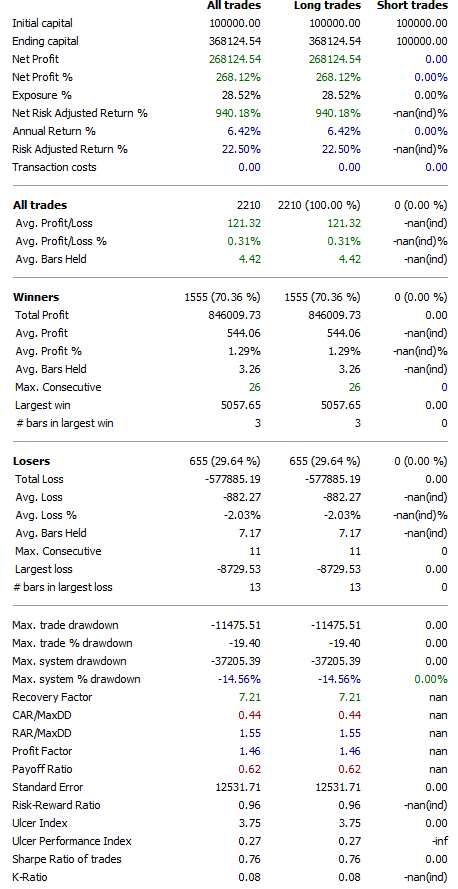
The first strategy, multiple days up and down, returns these numbers:
The second strategy, 3-day high/low, returns these numbers:
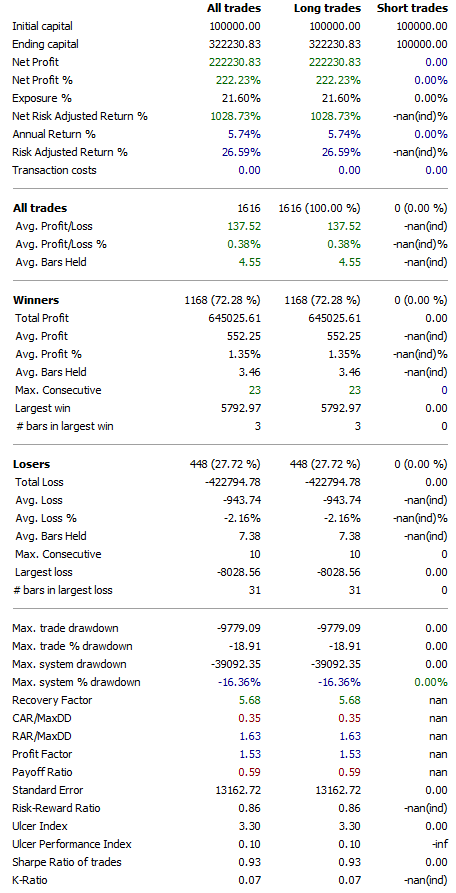
As you can see, both strategies perform reasonably well and have ending capital of 368 000 and 322 000. In other words, they yield the same results (in the ballpark at least).
If we add the two strategies together the strategy and system performance metrics look like this: