
MACD and Bollinger Bands Strategy – Rules, Setup, Backtest
There are some indicators you can easily combine to get the best out of the market. The moving average convergence divergence (MACD) and Bollinger Bands combination is one of the best synergic indicator combinations. You can use it to trade both a range-bound market and a trending market, depending on how you use them. Ever thought of a MACD and Bollinger Bands strategy?
The MACD and Bollinger Bands strategy refers to a trading method that makes use of both indicators in analyzing and trading the markets. While the MACD indicator is a momentum oscillator that is primarily used to analyze trends, Bollinger Bands is a volatility channel indicator that helps determine whether prices are high or low on a relative basis. The combination of MACD and Bollinger Bands may offer more insight into the current market and help predict how it could move in the future.

Related reading: – Different types of valid trading systems
In this post, we take a look at the MACD and Bollinger Bands strategy and include a backtest with specific and testable trading rules.
What is the Bollinger Bands indicator?
Developed by John Bollinger in the 1980s, Bollinger Bands is a volatility channel indicator that can also be used to determine whether prices are high or low on a relative basis. The indicator consists of three lines: a middle line, which is a 20-period (default setting) moving average, and an upper and a lower band, each of which is 2 standard deviations away from the middle line.
Bollinger Bands form a channel or an envelope around the price action, and the channel contracts or expands, depending on the level of volatility in the market (often resulting in a Bollinger Band squeeze). The indicator can be used to trade both trend-following and swing-based strategies.
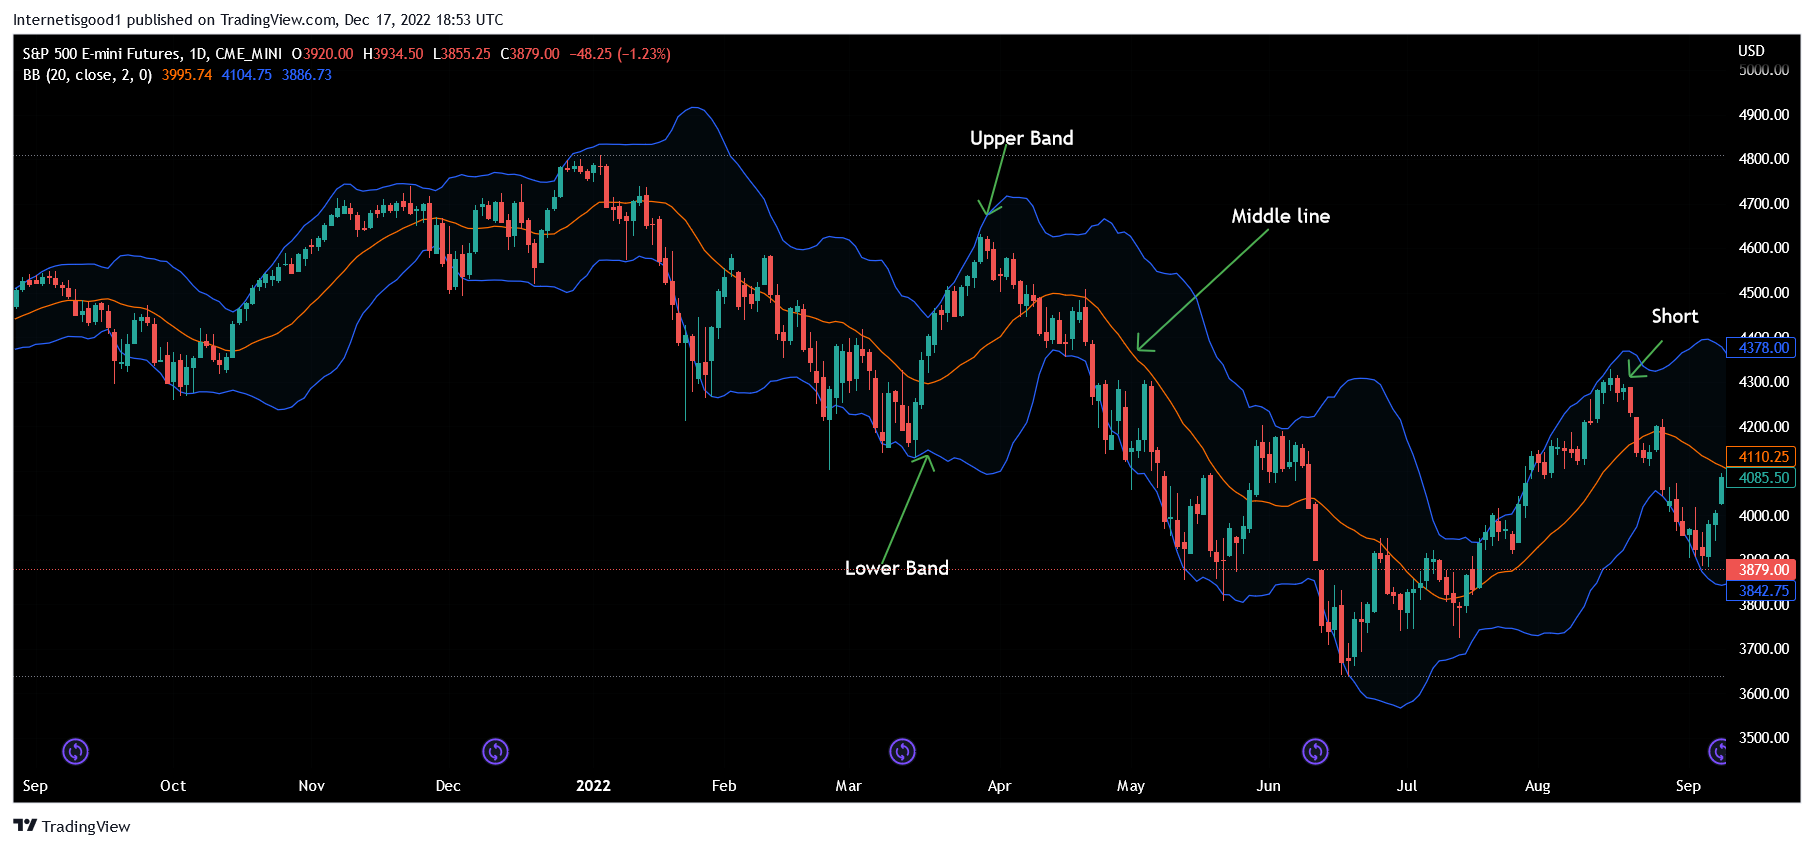
How the Bollinger Bands indicator is calculated
Bollinger Bands are simple to calculate. These are the steps:
- Calculate and plot a 20-period moving average for the middle line. You can change the period to anything you want that suits the market you are trading.
- Calculate the standard deviation of the moving average
- Plot a band 2 standard deviations above the moving average and another 2 standard deviations below
How the Bollinger Bands indicator is interpreted
Here are the common interpretations of the Bollinger Bands indicator:
- The upper and lower bands may indicate an extended price action: Prices have a tendency to bounce from the upper and lower bands, touching one band and then moving to the other band, which is why the indicator is commonly used in mean-reversion strategies. Also, you can use these swings to help identify potential profit targets even when trading other strategies. With a me