Relative Strength Index (RSI) And Moving Average Trading Strategy In Python (Rules, Backtest Results)
In this article, we will implement a trading strategy that will combine a Relative Strength Indicator and a Simple Moving Average. Let’s call it an RSI and moving average trading strategy. We explain the strategy and code it in Python.
What is the idea behind the strategy? That is to have both indicators that confirm a good entry point with acceptable risk and reward. The strategy is coded in Python and shown in detail.
- Python Trading Strategy Backtesting – How To Do It (Plenty of examples with code and images)
The logic behind RSI – the Relative Strength Indicator in Python
First, let us explain the logic of the Relative Strength Index (RSI). Why it is useful and under which circumstances it should be implemented?
Welles Wilder, the author of the indicator used the following general rules:
When the RSI is over 70, it is said that the security is overbought, and when the indicator is less than 30% is said that the security is oversold. You can read more about the RSI indicator on this link.
The formula is:
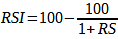
And:
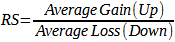
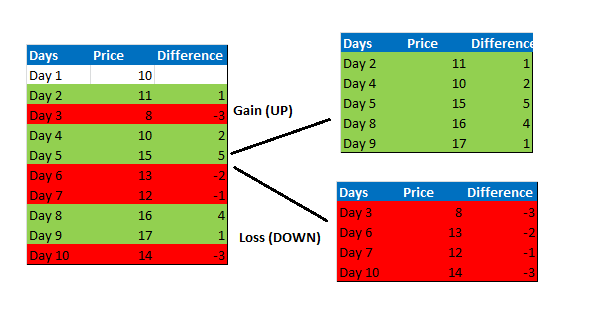
When we look at the formula there is only one variable – the other components are constant values. In the next table, we will see where the and come from: