RSI Mean Reversion Trading Strategy – (QQQ, Nasdaq)
We have previously published an article on using RSI on SPY (relative strength index). The RSI has proven to be a valuable indicator/tool for mean reversion in the main stock indices. Today we present an RSI trading strategy.
In this article, we look at how the RSI performs on QQQ – an RSI mean reversion trading strategy. At the end of the article, we add another indicator to boost performance (successfully). RSI 2 QQQ works well!
First, please read what the Relative Strength Index (RSI) is and what mean-reversion is:
You might also be interested in our RSI SPY trading strategy.
What is a good RSI for Nasdaq and QQQ?
Nasdaq RSI is a mean-reversion indicator and thus the strategy works best with a low reading on the RSI.
What is a low reading? In general, that is reading below 30. The lower the number of days used in the calculation, the more sensitive and volatile the RSI is.
In this article, we use only two days for the RSI (RSI 2). This means a low reading on the RSI is required to enter a position:
RSI QQQ strategy:
Let’s test the RSI trading strategy by setting the RSI reading to lower than x – thus we have an RSI 2 strategy on Nasdaq and QQQ. The trading rules are like this:
Trading Rules
[am4show have=’p2;p3;p58;p59;p130;p138;’ user_error=’Premium Post Access’ guest_error=’Premium Posts’]
- RSI(2) must be lower than 10.
- If number one is true, then enter at the close.
- Exit at the close when today’s close is higher than yesterday’s high.
[/am4show]
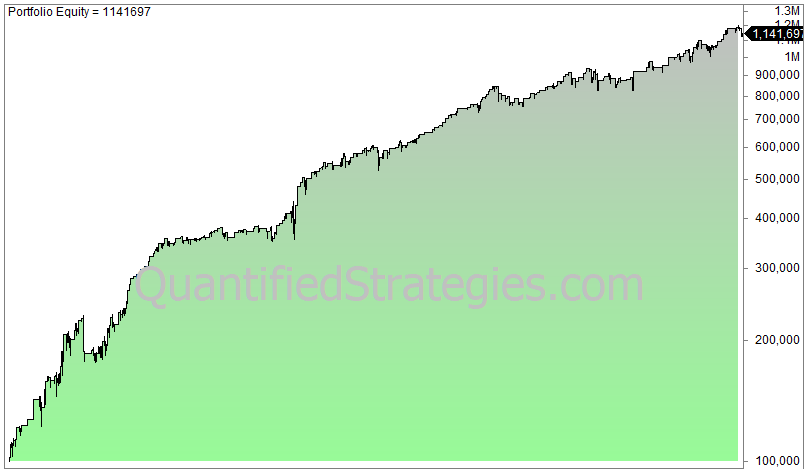
The RSI 2 strategy produces this equity curve (logarithmic chart) from QQQ’s inception until today: