Conclusions About Trend-Following Trading Systems: The S&P 500 Explained
Does trend following work in the S&P 500? We recently came across an article called Breaking into the Blackbox: Trend Following, Stop Losses, and the Frequency of Trading: The Case of the S&P 500. It’s written by academics, but in plain language without complicated math, so everyone can understand.
In this article, we look at how you can employ trend-following rules to trade the S&P 500.
What is trend following investing and trading?
Trend following involves finding trends in the marketplace, either by going long or short.
What is a trend? A trend must be quantified depending on the timeframe. Depending on your criteria, a stock can be trending on a weekly chart but not on a daily chart. There is no precise definition of a trend.
The essence of trend following is to quantify by using strict mathematical rules, for example by using a moving average: if the price is above the moving average, then the trend is up. If the price is below the moving average, then the trend is down. However, it is, of course, up to you to define the trend.
Does trend following work on stocks?
This is a question that is very hard to answer because every investor or trader has his or her own definition of a trend. We have seen very little research on individual stocks, but a lot has been done on stock indices, like this article, for example.
Are there any trends in the S&P 500? Let’s see:
Trend following the S&P 500:
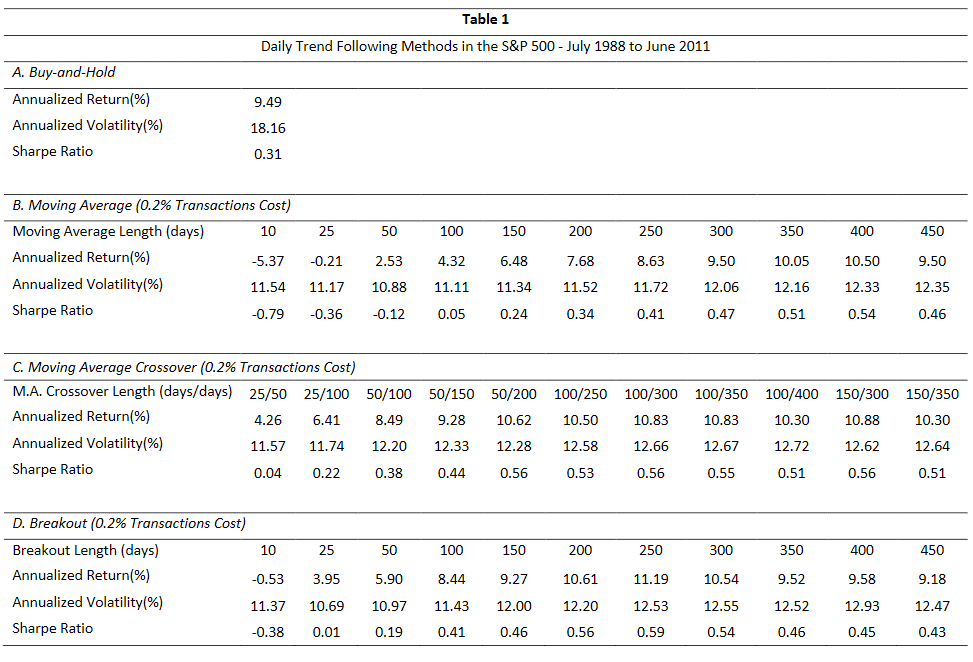
The article looked at three trend-following rules for the S&P 500 from July 1988 until June 2011:
- Simple moving averages ranging from 10 to 450 days.
- Moving average crossovers where the shorter duration moves above the longer duration average ranging from 25-50 and 150-350 days.
- Breakout rules, for example, when the index trades at an “x-day high” where x ranges from 10 to 450 days.
Before you continue, you might want to check out the trend-following system we published some days ago:
Trend-following questions addressed by the authors in the S&P 500:
The authors of the study wanted to investigate this:
- Does complexity add any value?
- Is frequency important? (The number of trades)
- Do stop-losses improve results?
Trend-following results in the S&P 500:
The main conclusions can be summarized in this table:
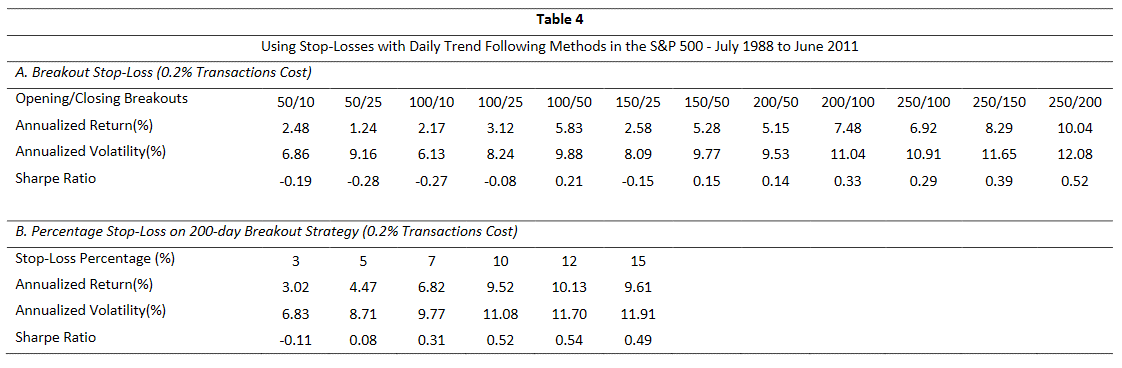
When the authors add a stop-loss they got the following results: