
Triple RSI Trading Strategy: Boost Your Win Rate to 90%
In the world of trading, the Relative Strength Indicator (RSI) stands as a timeless beacon of analysis. Invented by Welles Wilder in the 1970s, it has become a cornerstone of trading strategies.
Today, we unveil a fresh perspective on RSI with the Triple RSI Trading Strategy. This innovative approach harnesses the power of RSI in a new and modified form, boasting an impressive 90% win rate.
With just 83 trades since 1993, it may seem conservative, but each trade delivers a robust 1.4% gain on average.
Join us as we explore this high-performing strategy, where quality triumphs over quantity, and discover how it can improve your trading game.
The RSI indicator
We have explained how to both calculate and use the RSI indicator in a previous article:
If you are unfamiliar with RSI, we recommend you read that one before continuing reading.
Let’s explain the trading rules and logic behind the strategy before we backtest it:
Triple RSI trading rules
Most traders use RSI as a mean reversion oscillator. There is good reason for that, especially if you are looking to trade stocks or the stock market and looking for an indicator with high win rate. Since 1985 stocks have reverted to the mean. We can only guess why, but we believe program trading is one of the main reasons.
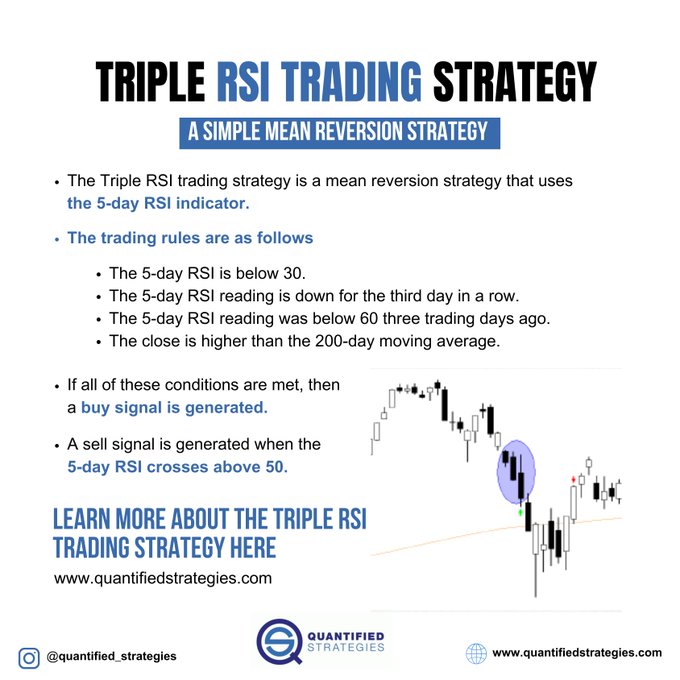
The Triple RSI trading strategy is also based on mean reversion. The trading rules are inspired by Larry Connors’ R3 strategy, but we have modified them. These are the trading rules:
[am4show have=’p2;p3;p58;p59;p130;p138;’ user_error=’Premium Post Access’ guest_error=’Premium Posts’]
- The 5-day RSI is below 30, and
- The 5-day RSI reading is down for the third day in a row, and
- The 5-day RSI reading was below 60 three trading days ago, and
- The close is higher than the 200-day moving average, and
- If 1-4 are true, then buy at the close.
- Sell at the close when the 5-day RSI crosses above 50.
[/am4show]
Triple RSI trading system example
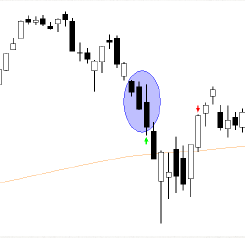
The chart below highlights an example of a trade. The blue area shows three down days with lower RSI readings, and the red line shows the 200-day moving average. The green arrow signals a trade, and the red arrow signals when we exit (with a small profit).
Triple RSI trading strategy backtest
We backtest SPY – the ETF that tracks S&P 500. When we put the trading rules above into Amibroker, we get the following equity curve:
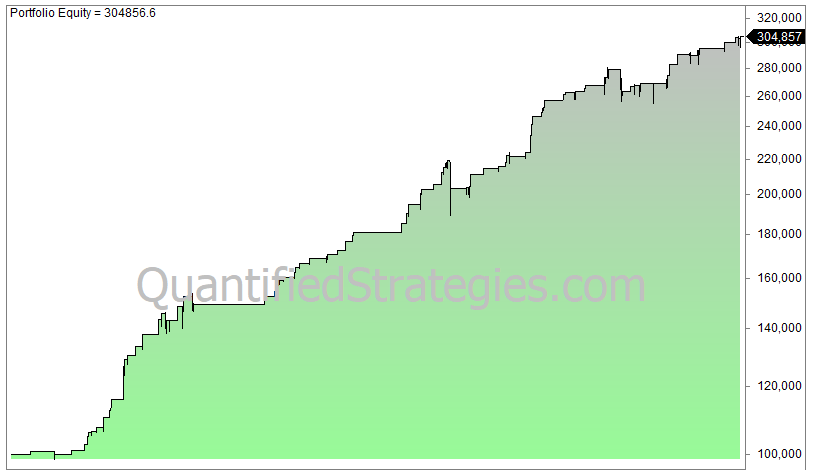
The 83 trades since 1993 are few, but the average gain is a solid 1.4% per trade. The win rate is 91%, and the profit factor is 5. It is a trading strategy with a high win rate. In a previous article, we argued the win rate is an underappreciated trading metric because a low win rate in most cases leads to behavioral trading mistakes – biases.
The statistics and performance metrics are excellent, b