

Turn of the Month for September (Dow Jones – DIA)
We are approaching the end of September; historically, the end and beginning of a month have been positive.
We have covered this anomaly multiple times for the S&P 500/SPY. Let’s find out how Dow Jones Industrial and its ETF (DIA) has performed since its inception in 1998.
We use the following trading rules:
Trading Rules
[am4show have=’p2;p3;p58;p59;p130;p138;’ user_error=’Premium Post Access’ guest_error=’Premium Posts’]
- We buy at the close on the last fifth trading day of the month, and
- We sell at the close of the fourth trading day of the new month.
[/am4show]
This is the equity curve:
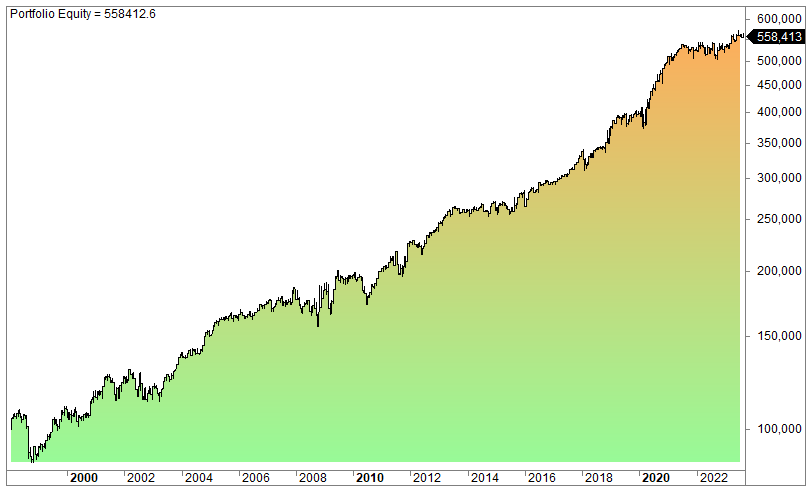
The average gain per trade is 0.6%, the win rate is 64%, and max drawdown is 20%. We can also add that the CAGR was 7% vs. buy and hold’s 8.2%.
The above is for all months. What about September (and the first days of October)?
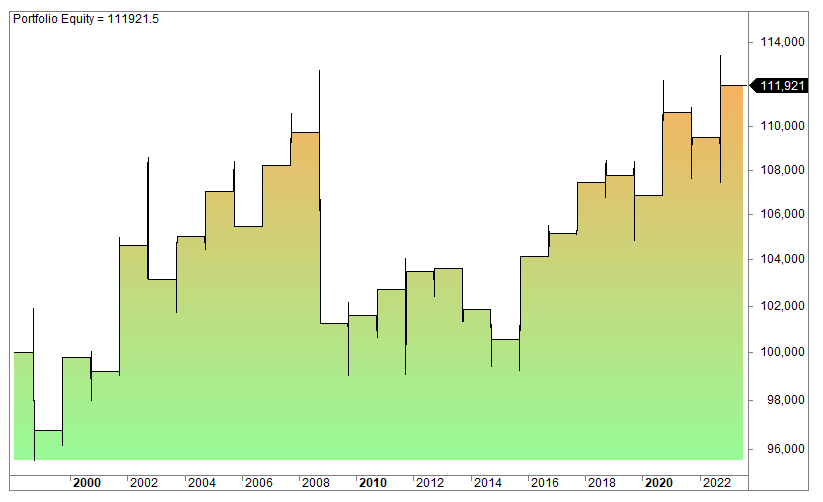
There are not many trades, but the average is lower than for the whole year: 0.49%.