
Ultimate Oscillator Indicator Trading Strategy (Backtest And Example)
Many momentum oscillators tend to turn very positive at the beginning of a major advance and quickly enter the overbought territory or even show bearish divergence while the market is still advancing. The ultimate oscillator attempts to correct that. Let’s find out what this oscillator is made of.
The ultimate oscillator (UO) is a momentum indicator designed to measure the price momentum of an asset across multiple timeframes. It uses three different periods (7, 14, and 28) to ascertain the momentum in the short, medium, and long-term market trends and then generates a weighted average of the three. Our backtests indicate that the indicator performs well over practically all settings, and you can make a very profitable mean reversion trading strategy out of it.
What is the ultimate oscillator?
The ultimate oscillator is a momentum indicator designed to measure the price momentum of an asset across multiple timeframes. It uses three different periods (7, 14, and 28) to ascertain the momentum in the short, medium, and long-term market trends and then generates a weighted average of the three.
The shortest timeframe has the most weight in the calculation, while the longest timeframe has the least weight. By using the weighted average of three different timeframes, the indicator is less volatility, which helps it to avoid the pitfalls in other oscillators that rely on a single timeframe — early overbought signals and bearish divergence during a strong price advance.
Many momentum oscillators tend to surge at the beginning of a strong advance, only to quickly become overbought or form a bearish divergence as the advance continues. The reason for this is that they are created for one timeframe. By incorporating longer timeframes into its calculation, the ultimate oscillator attempts to correct this fault. The oscillator is based on the notion that buying or selling “pressure” is determined by where a day’s closing price falls within the day’s true range.
What is the formula for ultimate oscillator?
The calculation of the ultimate oscillator involves the following steps.
Step 1: Calculating the Buying Pressure (BP)
The buying pressure is the amount by which the current day’s close is above the “true low”, which is the lesser of the current day’s trading low and the previous day’s close. The formula is:
BP = Close — Minimum(Low or Prior Close).
Step 2: Calculating the True Range (TR)
The true range is the difference between the “true high” and the true low above. The true high is the greater of the current day’s high and the previous day’s close. The formula is:
TR = Maximum(High or Prior Close) — Minimum(Low or Prior Close)
Step 3: Calculating the Averages for the various timeframes
The default timeframes are 7, 14, and 28. The average for each of the timeframes is calculated as follows:
Average7 = (7-period BP Sum) / (7-period TR Sum)
Average14 = (14-period BP Sum) / (14-period TR Sum)
Average28 = (28-period BP Sum) / (28-period TR Sum)
Step 4: Calculating the Ultimate Oscillator (UO)
The resulting three averages are combined in proportions 4:2:1 and scaled to make a percentage, with the values ranging from 0 to 100. This is given as follows:
UO = 100 x [(4 x Average7) + (2 x Average14) + Average28] / (4+2+1)
Below we have provided you with a chart to show how it looks like in Amibroker:
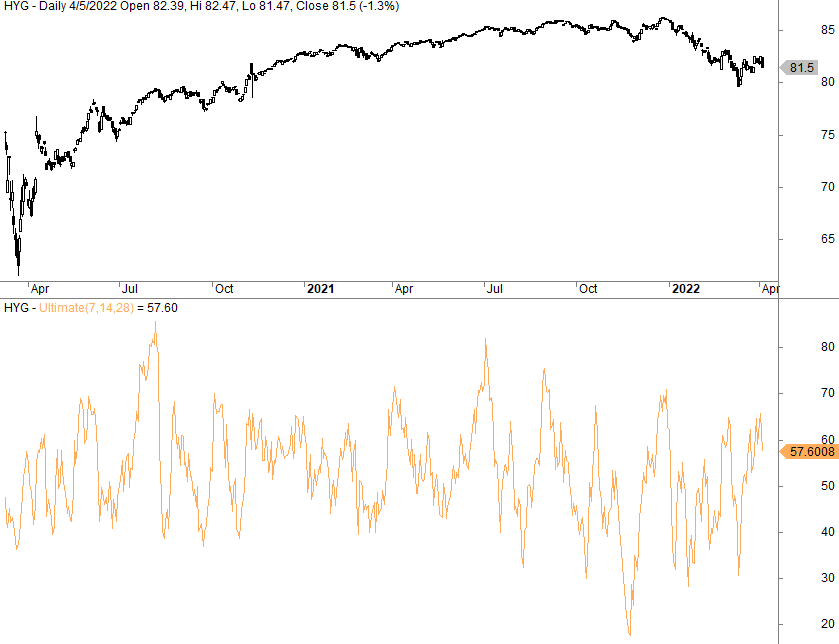
The upper pane is the price chart of HYG (the ETF tracking junk bonds) and the lower pane shows the ultimate oscillator with the default settings. As you can see, the indicator oscillates up and down, hence the name. It might help you in pointing out great entry points and where to sell, something we backtest later in the article.
Who invented the ultimate oscillator?
The ultimate oscillator was developed by Larry Williams in 1976, but it became popular after it was featured in Stocks & Commodities Magazine in 1985. The ultimate oscillator is just one of many Larry Williams strategies.
Larry Williams developed the concept as a way to account for the problems experienced in most oscillators when used over different lengths of time.
What does the ultimate oscillator tell you?
The indicator uses three different periods (7, 14, and 28) to ascertain the momentum in the short, medium, and long-term market trends. But it combines them by weighting them to get a more reliable momentum of the price than what you get from other oscillators that are based on one time frame.
As with most oscillators, the ultimate oscillator moves between 0 and 100, and just like the RSI, levels below 30 are considered oversold, and levels above 70 are considered overbought.
Trading signals are only generated when there is a divergence between the price and the indicator, but three criteria must be met. For example, for the indicator to generate a buy signal, these conditions must be met:
- A bullish divergence must form, which means that the price makes a lower low but the indicator is at a higher low.
- The first low in the divergence (the lower one) must have been below 30 — that is, the divergence started from oversold territory and is more likely to result in an upside price reversal.
- The ultimate oscillator must rise above the divergence high — the high point between the two lows of the divergence.
The opposite is required to generate a sell signal.
Let’s go on to backtest some trading strategies based on the indicator:
Ultimate oscillator trading strategy
Let’s first backtest using the default parameters of the indicator: 7, 14, and 28. We buy when it crosses below 40 and we sell when it crosses above 50. The equity curve looks like this when we backtest on SPY (the ETF tracking S&P 500):
<