
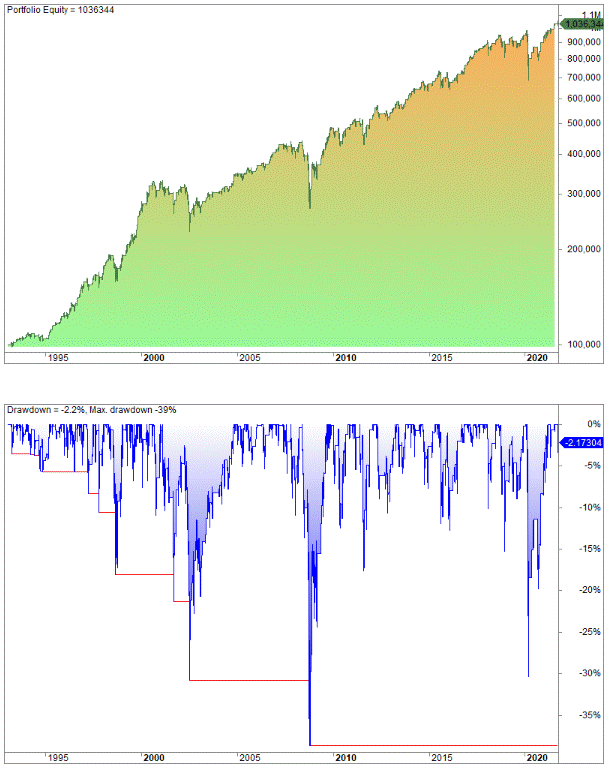
WilliamsVixFix Trading Strategies – Does It Work?
WilliamsVixFix indicator was invented back in 2007 when the well-known trader and “indicator innovator” Larry Williams wrote an article in Active Trader about VIX and how you can create your synthetic VIX for any security you like. The aim of Williams was to create a “synthetic” VIX reading for other instruments than the S&P 500, the Nasdaq, and the Dow Jones 30.
In this article, we explain what the WilliamsVixFix indicator is, how you can use it, and whether is a good trading tool or not. We test one WilliamsVixFix trading strategy. The indicator works.
What is the VIX?
The VIX is derived from the implied volatility of stock index options on the Chicago Board Of Trade (CBOE).
It was introduced in 1993 and is intended to represent the “fear” or “complacency” of the market. Unfortunately, the VIX is only calculated for the S&P 500, Nasdaq, and the Dow Jones 30.
Implied volatility is one of the major components in the price of an option: the higher the implied volatility, the more expensive the premium. Think of it as insurance. The more risk, the more you need to pay for insurance.
Opposite, when market participants see few clouds on the horizon, premiums go down as the perceived risk is smaller. The more volatility in the markets, the more you need to pay for insurance.
In the Black and Scholes option pricing model, implied volatility is the only factor that is “unknown” and subjective.
How does the VIX work?
The VIX oscillates up and down. A high reading means investor sentiment is one of increased fear, while low readings are associated with low-volatility conditions (and market tops). Thus, the VIX has a negative correlation to the S&P 500.
Is a high VIX good or bad?
A rule of thumb is that low volatility is often associated with market peaks, while high volatility is associated with market lows.
When the VIX is high, it shows fear is high and vice versa. A high VIX normally means the market has fallen, at least in the short term, and the risk premium for owning stocks increases.
This is normally a good time to buy for short-term traders. The stock market has turned out to be mean revertive, and we all know the long-term tailwind from earnings growth and monetary inflation.
However, the VIX measures the implied volatility for one month. A high reading today might be a good short-term opportunity to buy, but not necessarily a good entry for the long term.
As always, make sure you make quantified tests before you do any trades, but our experience indicates that volatility trading strategies work pretty well.
Below are the daily VIX readings for the S&P 500 since 2014:
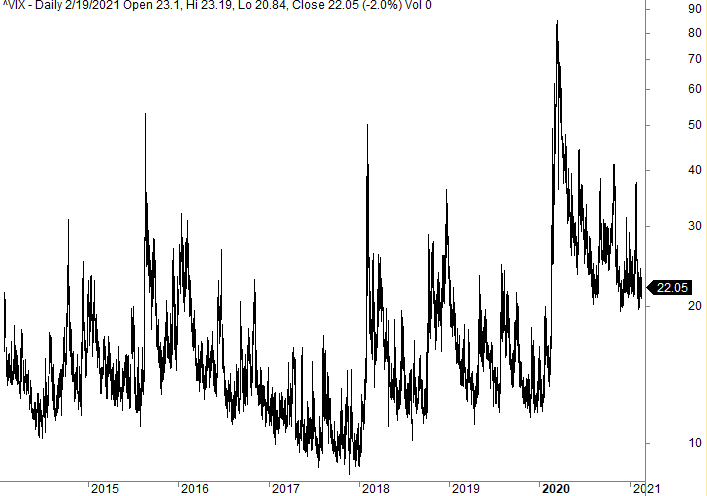
Clearly, the VIX has been very high since COVID-19 struck. Because of this, we can’t say that one level is good and one level is bad. It all varies and you need to use moving indicators.
How is the Williams Vix Fix calculated?
Larry Williams wanted to make a synthetic VIX for other products and not just the main stock indices.
The formula for Williams VixFix is as follows:
Formula VIX Fix = (Highest (Close,22) – Low) / (Highest (Close,22)) * 100
What does this mean? In plain English it means the following and has the following definition:
Trading Rules
[am4show have=’p2;p3;p58;p59;p130;p138;’ user_error=’Premium Post Access’ guest_error=’Premium Posts’]
- Find the highest close over the last 22 days and subtract the low of today (or the current bar).
- Divide by the highest close of the past 22 days.
- The result is multiplied by 100 to “normalize” the indicator.
[/am4show]
Why 22 days? 22 days represent the normal number of trading days in a month.
The formula is, as you can see, pretty easy. What it measures is the price volatility of the last 22 trad