
Study and Backtest Of All 75 Candlesticks – Which One Works And Which One Is Best?
We have yet to see much quantified backtest of candlestick patterns. Practically all candlestick “analysis” is based on anecdotal evidence and some random charts showing successful trades (and ignoring the bad ones). Do candlesticks really work?
We decided to find out and sat down to quantify ALL the candlestick patterns. Over the last weeks, we tracked down ALL candlestick patterns and backtested them. The results are summarized in the table below, and additionally, we have compiled all the patterns into easy-to-test Amibroker code.
The result is a complete backtest of all 75 candlestick patterns that exist!
We have made two products based on our research:
- Product one: Historical Backtests of all the patterns with graphs, performance metrics, and explanations.
- Product two: A second product that includes the Amibroker code for all patterns.
All historical backtesting is based on S&P 500 (SPY) from its inception until today.
75 candlestick patterns backtested
If you search the internet and make a table of all the candlestick patterns, you might count a higher number than 75. However, many patterns are more or less the same with just minor differences, and some are even the same but with a different name.
How do you get access to our data-driven trading research?
The research is accessible via two products in our shop: one product with all the reports and one product that additionally has all the Amibroker code.
10 best candlestick patterns – Performance Sample
To give you an idea if it works or not, we compiled a historical backtest (S&P 500) with the ten best candlestick patterns that have more than 50 trades since 1993 (ranked on profit factor). The equity curve below summarizes how 100 000 invested in 1993 would have grown until today (compounded and taking just one position at a time):
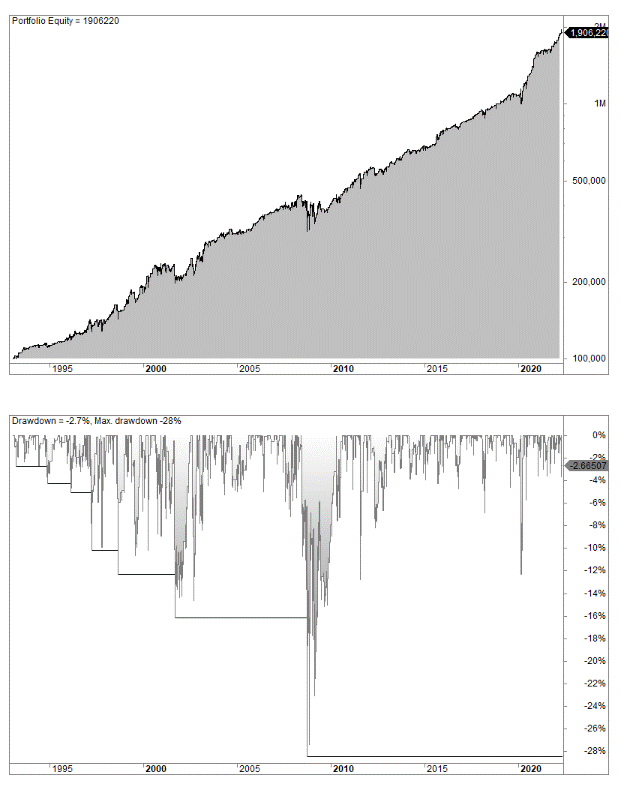
The strategy performance metrics read like this (slippage and commissions not included):
- #trades: 705
- CAGR: 10.6 (buy and hold 7.9%) – dividends not included in the backtest
- Win rate: 72%
- Exposure (time in the market): 35%
- Avg bars held: 4.7 (average holding time is almost 5 trading days)
- Max consecutive winners: 18
- Max consecutive losers: 4
- Max drawdown: 28%
- Risk-adjusted returns: 30.4%
- Profit factor: 2.5
- Sharpe Ratio: 1.35
The annual returns of the ten best candlestick patterns look like this:
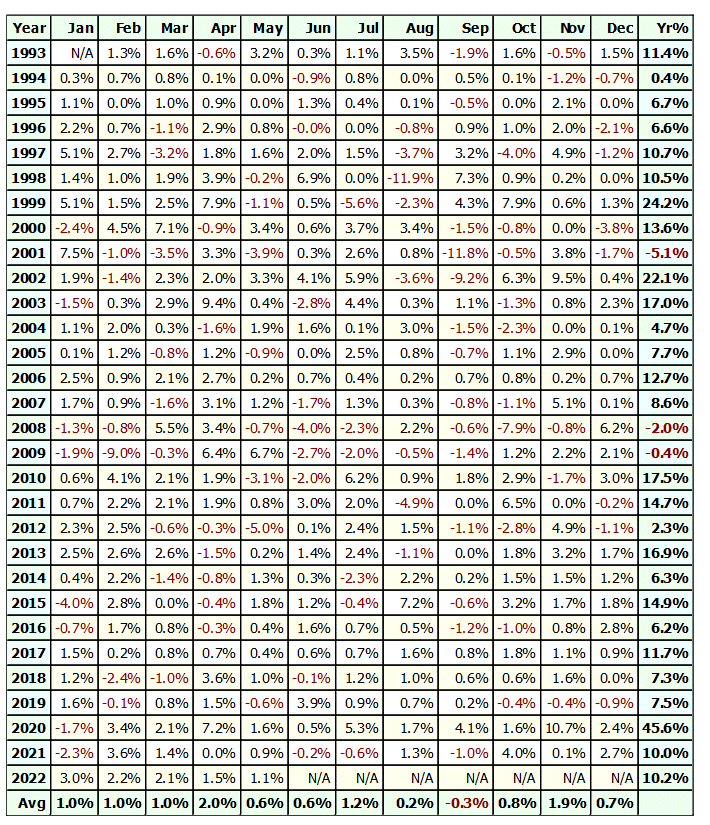
We would say this is pretty good! You would have managed a better return than owning the S&P 500 and, at the same time, being invested only 35% of the time and thus avoiding the worst drawdowns. The risk-adjusted return is 30%! (Please read more about risk-adjusted returns)
Is it any guarantee that the future will be just as good? Of course not.
The results are summarized in this sortable table:
| Pattern | #Trades | Avg P\L | Max DD | Win Ratio | Profit Factor | Annual Return | Exposure | Rank |
|---|---|---|---|---|---|---|---|---|
| 1 | 5 | 4.15 | -2.43 | 100 | N/A | 0.68 | 0.18 | 1 |
| 2 | 2 | 1.37 | 0 | 100 | N/A | 0.09 | 0.03 | 2 |
| 3 | 10 | 1.3 | -4.41 | 90 | 5.85 | 0.44 | 0.52 | 3 |
| 4 | 47 | 1.04 | -4.96 | 82.98 | 5.36 | 1.64 | 2.58 | 4 |
| 5 | 20 | 0.98 | -3.96 | 80 | 7 | 0.66 | 1.11 | 5 |
| 6 | 106 | 0.73 | -14.34 | 80.19 | 2.92 | 2.59 | 4.94 | 6 |
| 7 | 55 | 0.72 | -9.68 | 74.55 | 2.68 | 1.32 | 2.73 | 7 |
| 8 | 15 | 0.7 | -8.94 | 73.33 | 2.48 | 0.34 | 0.8 | 8 |
| 9 | 25 | 0.67 | -18.63 | 88 | 1.91 | 0.53 | 1.21 | 9 |
| 10 | 1 | 0.66 | -0.48 | 100 | N/A | 0.02 | 0.04 | 10 |