3 Strategy Bundle of 24-Hour Day Trading Strategies | Overview
This bundle consists of three strategies that can be labeled volatility trading strategies. The idea and logic work in a variety of assets.
In all our bundles, you will find Amibroker code, Tradestation code, and the strategy written in plain English. The strategies are long-only due to the nature of the index.
All three strategies have been published as a monthly trading edge. Please consider becoming a member to get many more trading strategies.
The strategies are long-only.
We don’t give rebates if you already believe you have one of the strategies. We believe the strategies are pretty cheap anyway.
Please check out our other Strategy Bundles.
Here are the details about each strategy (backtested on SPY/ES):
24-hour day trading strategy #1
Below are the equity curve and performance metrics for S&P 500 (SPY):
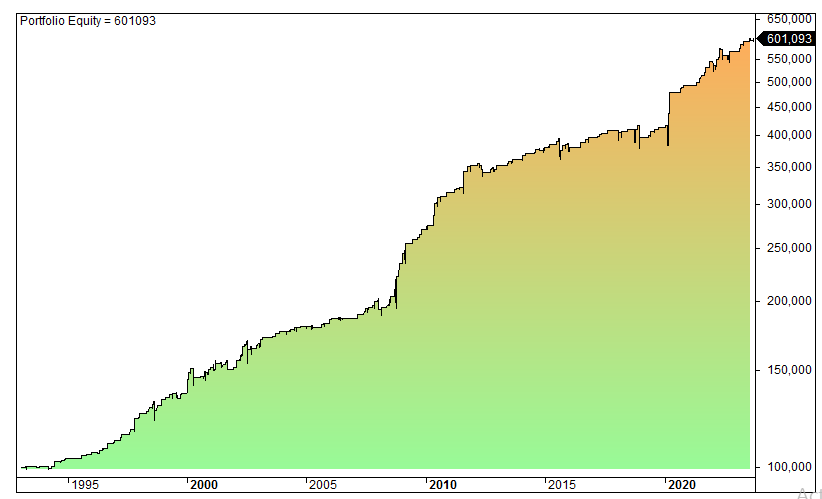
Strategy and performance metrics:
- #trades: 456
- Average gain per trade: 0.41%
- CAGR: 6.1%
- Time spent in the market: 6%
- Max drawdown: 11%
- Risk-adjusted CAGR: 102%
- Win rate: 64%
- Max consecutive losers: 6
- Max consecutive winners: 15
- Profit factor: 1.9
- Sharpe Ratio: 2.2
24-hour day trading strategy #2
Below are the equity curve and performance metrics for S&P 500 (SPY):
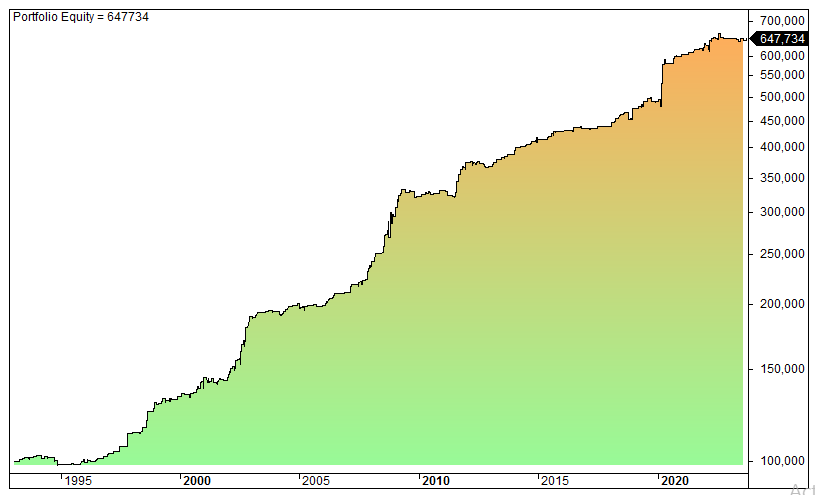
Strategy and performance metrics:
- #trades: 392
- Average gain per trade: 0.49%
- CAGR: 6.2%
- Time spent in the market: 5%
- Max drawdown: 7%
- Risk-adjusted CAGR: 123%
- Win rate: 65%
- Max consecutive losers: 7
- Max consecutive winners: 13
- Profit factor: 2.9
- Sharpe Ratio: 2.3
24-hour day trading strategy #3
Below are the equity curve and performance metrics for S&P 500 (SPY):
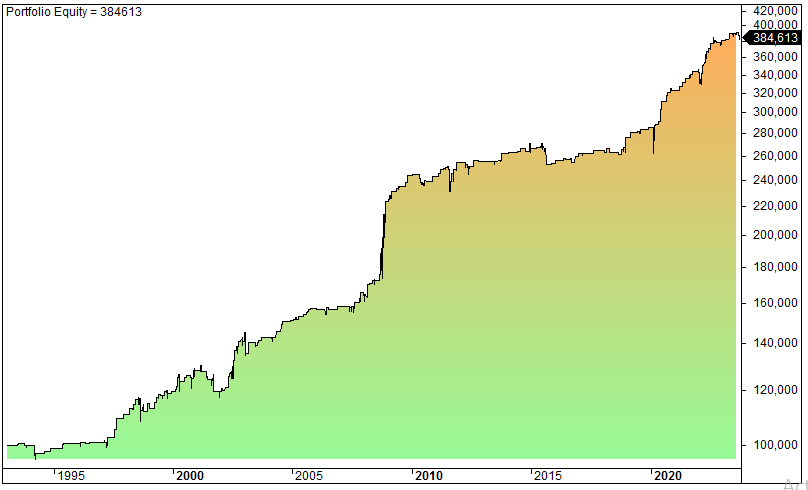
Strategy and performance metrics:
- #trades: 2417
- Average gain per trade: 0.34%
- CAGR: 4.5%
- Time spent in the market: 5%
- Max drawdown: 10%
- Risk-adjusted CAGR: 83%
- Win rate: 60%
- Max consecutive losers: 5
- Max consecutive winners: 12
- Profit factor: 1.7
- Sharpe Ratio: 1.7
24-hour day trading strategy #4 (all three strategies combined)
Below are the equity curve and performance metrics for S&P 500 (SPY) for all three strategies:
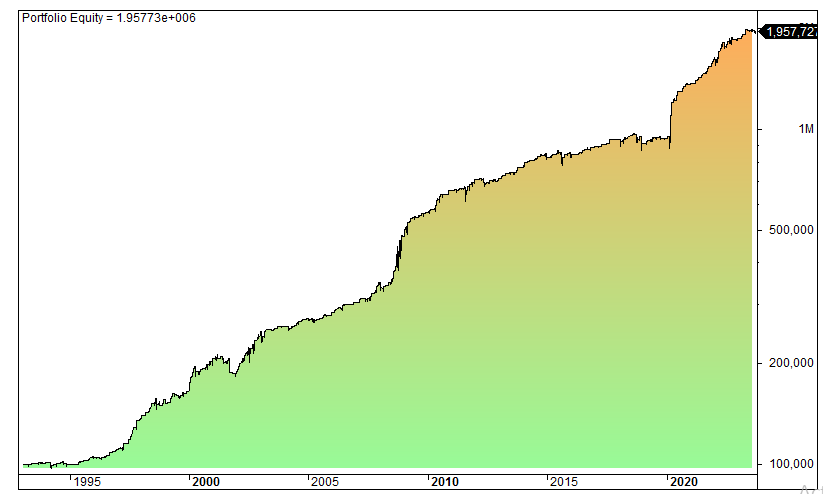
Strategy and performance metrics:
- #trades: 946
- Average gain per trade: 0.33%
- CAGR: 10.1%
- Time spent in the market: 12%
- Max drawdown: 15%
- Risk-adjusted CAGR: 83%
- Win rate: 62%
- Max consecutive losers: 7
- Max consecutive winners: 14
- Profit factor: 1.8
- Sharpe Ratio: 1.9
All three strategies combined for Nasdaq 100 with leverage (QLD):
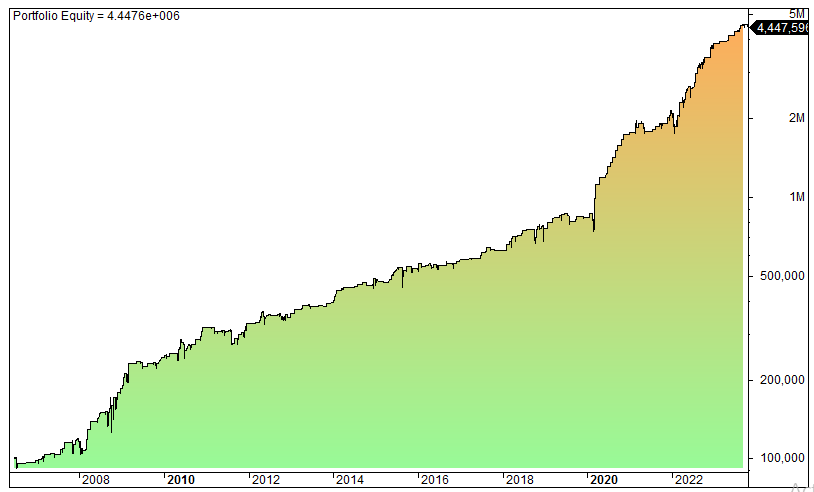
Strategy and performance metrics:
- #trades: 556
- Average gain per trade: 0.75%
- CAGR: 24.4%
- Time spent in the market: 12%
- Max drawdown: 26%
- Risk-adjusted CAGR: 191%
- Win rate: 60%
- Max consecutive losers: 9
- Max consecutive winners: 18
- Profit factor: 2.0
- Sharpe Ratio: 1.9
FAQ:
What is included in the volatility trading strategies bundle?
The volatility trading strategies bundle consists of three strategies applicable to various assets. Each bundle includes Amibroker code, Tradestation code, and a detailed strategy description in plain English. All strategies in the bundle are designed for long-only positions due to the nature of the index.
How have the strategies performed individually?
Each strategy within the bundle has been backtested on the S&P 500 (SPY) with specific performance metrics. These include metrics such as the number of trades, average gain per trade, CAGR (Compound Annual Growth Rate), time spent in the market, max drawdown, risk-adjusted CAGR, win rate, max consecutive losers, max consecutive winners, profit factor, and Sharpe Ratio.
What happens if I combine all three strategies?
Combining all three strategies into one portfolio, backtested on S&P 500 (SPY), yields a cumulative CAGR of 10.1%, with a time spent in the market of 12%, a max drawdown of 15%, and a Sharpe Ratio of 1.9. And also there is a combined strategy for Nasdaq 100 with leverage (QLD), showing a CAGR of 24.4%, time spent in the market of 12%, a max drawdown of 26%, and a Sharpe Ratio of 1.9.