A Profitable Mean Reversion Strategy Exploiting Weekday Trends
Mean reversion trading strategies are still working very well in the stock market, at least in the main indices and the majority of the sectors.
Back in 2013, we published a backtest that looked at the performance of S&P 500 (SPY) when both Thursday and Friday were down days.
This was one of the first backtest we did on the website. We traded the strategy ourselves, but we abandoned the strategy a couple of years later because we found something that worked better.
Specifically, we looked at the following trading rules in 2013:
[am4show have=’p2;p3;p58;p59;p130;p138;’ user_error=’Premium Post Access’ guest_error=’Premium Posts’]
- Today is Friday.
- Yesterday (Thursday) was down more than -0.15% and today also more than -0.15%. 0.15% is used to have some wiggle room because you have to send the orders before the market closes.
- Exit at the close after two days (usually on Tuesdays).
[/am4show]
Per July 2022 these trading rules have the following equity curve:
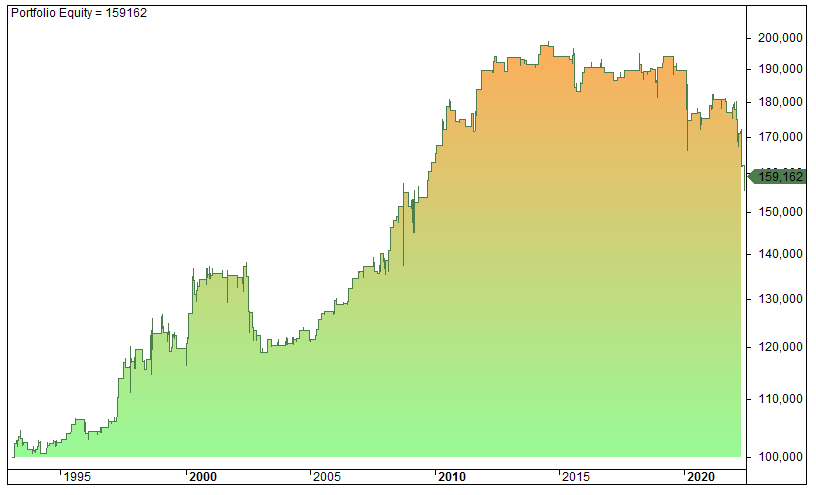
This is not a good equity curve.
If we have used the same buy rules but exit after N-days we get the following table:
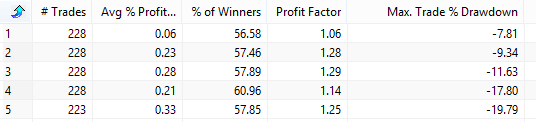
The first column shows when we exit (1 is Monday, 2 is Tuesday, etc.)
[am4show have=’p2;p3;p58;p59;p130;p138;’ user_error=’Premium Post Access’ guest_error=’Premium Posts’]
Can the strategy be improved? Let’s have the same entry, but change the exit to either IBS>0.7 or have a time-exit at next Friday:
[/am4show]
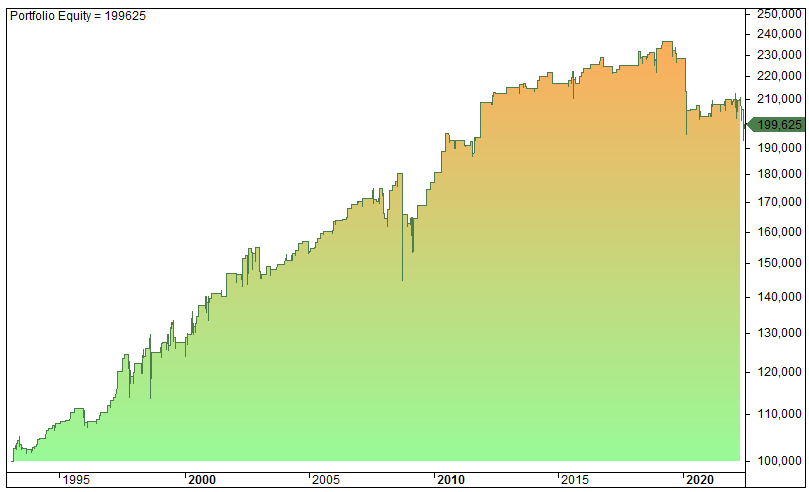
A lot better, but poor returns over the last years. Compared to the Turnaround Tuesday strategy this is poor.
FAQ:
What are mean reversion trading strategies?
Mean reversion trading strategies are approaches that capitalize on the tendency of asset prices to revert to their historical average or mean. Traders employing these strategies look for situations where the price has deviated significantly from its average, anticipating a return to the mean.
Can you provide an example of a mean reversion strategy?
Certainly. An example of a mean reversion strategy is the one outlined in a backtest for S&P 500 (SPY) on down days (Thursday and Friday). The strategy involves entering the market on Friday if Thursday had a decline of more than -0.15% and exiting after two days, typically on Tuesdays.
How did the mentioned mean reversion strategy perform in the backtest?
The backtest results for the mentioned mean reversion strategy showed an equity curve that was not favorable. However, by adjusting the exit conditions, such as exiting after a certain number of days or using different exit criteria like IBS>0.7 or a time-exit at the next Friday, improvements in performance were observed.