200 Day Moving Average Trading Strategy – (With Backtest)
The 200-day moving average trading strategy is frequently used as an indicator in the financial markets. Who hasn’t heard about the “Death Cross”, “support at the moving averages”, “the trend is positive because the price is above the averages”, etc.? Among the moving averages, the 200-day moving average is probably the most used and referred to.
This article looks at the 200 day moving average and how it works, why it works, and additionally why it sometimes doesn’t work. We present a 200-day moving average strategy and the simple 200-day moving average rule. Also a couple of quotes by Paul Tudor Jones about the 200 day MA.
The main advantages of the 200-day moving average are simplicity, riding the trend, and playing defense. However, without a recession and falling prices, you are unlikely to beat buy-and-hold because of the many whipsaws. As with most things in life, the 200-day moving average comes with both pros and cons. The 200-day moving average strategy is no silver bullet.
Included in this article are some 200-day moving average trading strategies and rules.
Let’s start with a short primer on what a moving average is:
What is a 200 day moving average?
Hopefully, most readers of this website have some basic mathematical knowledge and understand intuitively what a moving average is. Anyway, we start by describing what a moving average is:
A moving average is the sum of the x last closes divided by the same x. For example, a ten-day moving average summarizes the closing prices over the last ten days and divides the sum by ten. On the next day, the process is repeated by including the most recent close and dropping the eleventh most recent close.
There are different ways to calculate a moving average: simple, exponential, and linear (for example). We have previously covered the basics of moving averages in this article:
- Are moving averages good or useless? (Quantified strategies)
The moving averages are all about trend-following
The main idea of a moving average is to capture trends in the market. A moving average is an extremely simple tool to determine the trend: if the close is above the 200 day moving average, the trend is up. If the close is below, the trend is down. This is as simple as it gets.
Is it too simple or naive to work?
No, it’s not. If you want proof you can have a look at the Mt. Lucas Management Index (the MLM Index) which tracks a basket of commodities: If the commodity’s price is above the 200-day moving average at the end of the month, a long position is held for the next month. If the price is below the moving average, a short position is held.
Can it get any simpler?
And it works pretty well. We have covered the performance of the MLM Index and why trend following works in a separate article: Does trend following work? Why does it work?
We have covered a few other trend-following strategies in separate articles:
- A simple trend-following system/strategy on the S&P 500 (By Meb Faber and Paul Tudor Jones)
- Are moving averages good or bad as trading strategies? We backtest all variants of MAs
- Trend-following system/strategy in gold (12-month moving average)
- Conclusions about trend-following the S&P 500
- Trend following strategies Treasuries
- Is Meb Faber’s momentum/trend-following strategy in gold, stocks, and bonds still working?
Why a 200 day moving average, why not 183?
There is no particular reason to use a 200 day moving average (200 MA) than, for example, 183 days except that it’s a round number. You risk curve fitting if you optimize to another number of days. Furthermore, 200 days is a long average and thus captures the long-term trend.
However, there might be a reasonable explanation for why you could, for example, go for a 182-day moving average, or 213 for that matter: To avoid crowding.
If you are afraid of many traders and investors getting the same signal on the same day, you can use another moving average that is reasonably close to the 200-day average.
Simple moving average or exponential moving average?
Most traders choose between two types of moving averages when they make moving average strategies: the simple moving average (SMA) or the exponential moving average (EMA). In this article, we use the simple moving average (SMA). We have, of course, tested both and the differences are not that big. We use the SMA because it’s the “simplest” – hence the name.
If you are interested in reading more about moving averages, you can go to our “landing page” where we link to all the moving averages that exist (20 different ones):
Paul Tudor Jones On why the 200-day moving average works: It’s all about playing defense
My metric for everything I look at is the 200-day moving average of closing prices. I’ve seen too many things go to zero, stocks and commodities. The whole trick in investing is: “How do I keep from losing everything?” If you use the 200-day moving average rule, then you get out. You play defense, and you get out.
The quote above is from Paul Tudor Jones when he was interviewed by Micheal Covel, the author of Trend Following.
The main reason why the 200 day moving average works are that it keeps you out of a bear market. Look at what happened in the S&P 500 in 2007-09:
The chart shows that the moving average took you out in late 2007 at 113 except for a false signal in May 2008. You reentered in May 2009 at 73 and kept you in for a long time when quantitative easing made the markets move higher. Paul Tudor Jones is right in that the 200-day moving average is all about playing defense.
And not to mention in the oil price action in 2020:
The chart shows that the average took you out at 65 in January 2020 and you reentered in October and November 2020 at around 40. Perhaps many traders believe this doesn’t amount to much, but how would you react to seeing your position go to almost zero during the Covid-mess?
The 200-day moving average works when you have recessions because it takes you out before a bear market hits. It saves you money and you can start compounding again at higher levels when the dust settles.
200-day moving average and Paul Tudor Jones video
We have made a video about Paul Tudor Jones, and you can find the 200-day moving average explained in the video:
When the 200-day moving average is not working
The GFC in 2008/09 is a perfect example of explaining how such a moving average is useful.
However, when there is no significant bear market, the moving average might fail to work properly.
The reason is simple: the main reason why the 200-day moving average works is that it keeps you out of bear markets. Obviously, if it’s no bear market, you will underperform compared to buy and hold. You will have many whipsaws that cost commissions, slippage, and lost opportunities.
As long as the central bankers interrupt the business cycles with more money printing, quantitative easing, and protecting business failures the moving averages will underperform.
To better illustrate when a moving average works and not we look at the long-term returns of the S&P 500:
The 200 day moving average strategy on the S&P 500 (Backtest)
Let’s test this simple 200 day moving average strategy with the following trading rules:
Trading rules
[am4show have=’p2;p3;p58;p59;p130;p138;’ user_error=’Premium Post Access’ guest_error=’Premium Posts’]
- Buy when the close of the S&P 500 crosses above the 200-day average,
- Sell when it closes below the average.
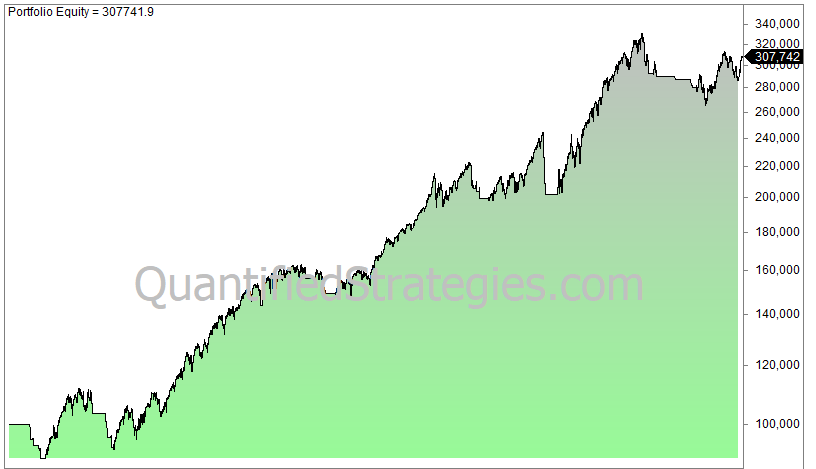
This is a crossover system. It can’t get any simpler than that! Here is the return (log chart) of investing 100 000 in 1960 and reinvesting and compounding until today:
[/am4show]
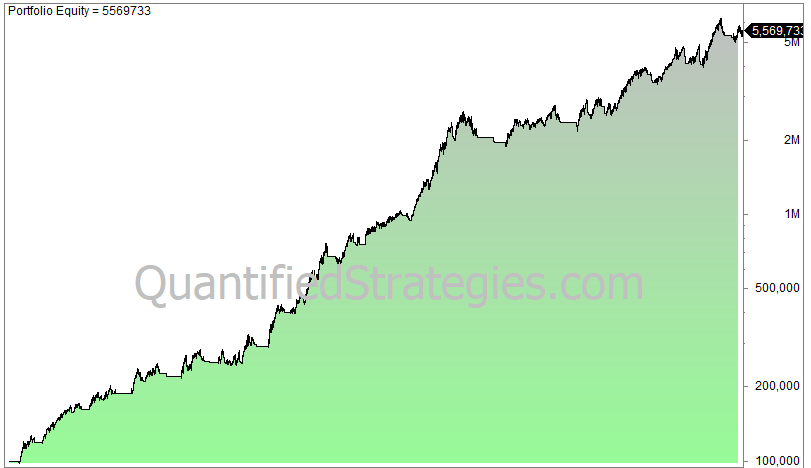
The 200DMA strategy has worked remarkably well:
- 199 trades since 1960.
- CAGR is 6.75, buy and hold is 7% (reinvested dividends not considered).
- 2.4% average gain per trade.
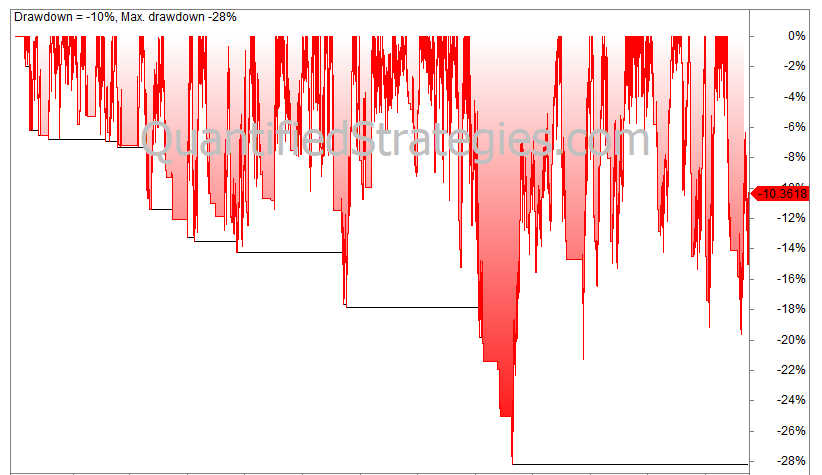
- Max. drawdown is 28%, buy and hold drawdown is 56%.
In other words, the 200-day moving average strategy has almost managed to keep track of the S&P 500 while having substantially lower drawdowns. The downside is that you might face tax bills because of the non-deferred capital gains.
We believe low drawdowns are underappreciated:
- Why is max drawdown important in trading? What is a good drawdown percentage?
- How to deal with drawdowns (How to prepare and minimize drawdowns)
The S&P 500 since the GFC in 2007/08:
However, as we indicated above, the strategy most likely underperforms in the absence of a long recession and falling prices.
Let’s test the 200-day moving average strategy from the bottom in March 2009 until today (buy when the close is above, sell when it closes below the average):
The CAGR is 8.5% but that is dwarfed by the buy and hold CAGR of 12.8%. Max drawdown is still lower at 19% vs. 34%, but the underperformance is huge.
The reason is simple: There are no major recessions. As long as the markets keep going up, the 200-day moving average strategy will get a lot of whipsaws and never keep track of buy and hold.
A perfect example is what happened in 2010:
During the summer of 2010, you would face 7 trades of which only one showed a gain. However, the losses were offset because the last trade entered on the 29th of October kept you in until July 2011 with a nice gain.
Jeremy Siegel’s 200 day moving average strategy (Backtest)
Jeremy Siegel is a professor at Wharton and has written the bestseller Stocks For The Long Run. Siegel looked at data for the Dow Jones Industrial Average and backtested a twist of the 200 day moving average strategy. We don’t have the book in our investment library, but we came across the strategy by reading Meb Faber’s white paper called A Quantitative Approach to Tactical Asset Allocation.
We quote from Faber’s white paper:
Jeremy Siegel investigates the use of the 200-day SMA in timing the Dow Jones Industrial Average (DJIA) from 1886 to 2006. His test bought the DJIA when it closed at least 1 percent above the 200-day moving average, and sold the DJIA and invested in Treasury bills when it closed at least 1 percent below the 200 day moving average. He concludes that market timing improves the absolute and risk-adjusted returns over buying and holding the DJIA. Likewise, when all transaction costs are included (taxes, bid-ask spreads, commissions), the risk-adjusted returns are still higher when employing
market timing, though timing falls short on an absolute return measure.
We already know that the risk-adjusted return (please read trading strategy and system performance metrics ) is very good (look at our first backtest further up of S&P 500).
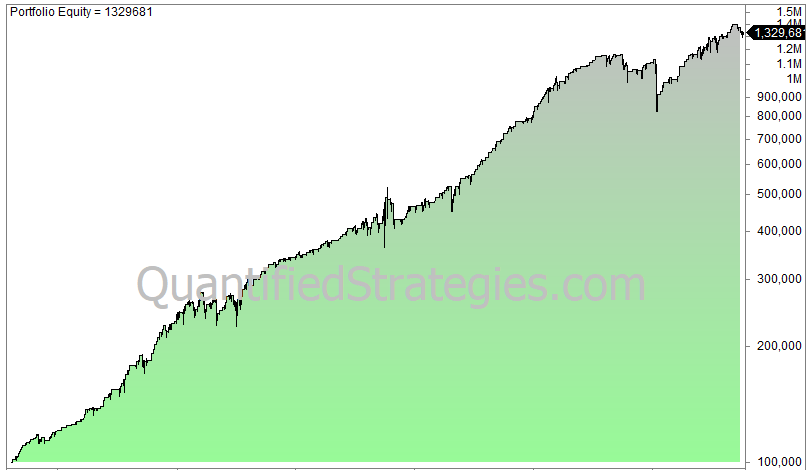
Let’s backtest Siegel’s strategy and see how it compares to our original 200-day moving average strategy. We test on S&P 500 from 1960 until today:
- 197 trades since 1960.
- CAGR is 6.73% (reinvested dividends not considered).
- 2.4% average gain per trade.
- Max. drawdown is 26%.
Jeremy Siegel’s version of the 200-day moving average strategy performs slightly better than the original strategy, but not by much. We did an optimization by testing many variants of Siegel’s version but the overall results are very much in line with Siegel’s.
The RSI (and other indicators) and the 200 day moving average strategy:
The beauty of backtesting is that you can test a lot of ideas in literally just seconds. Let’s first test how we can utilize the 200 day moving average strategy.
The core strategy is as follows:
- Enter at the close when the S&P 500 closes below a five-day RSI of 35.
- Sell at the close when the same five-day RSI crosses above 50.
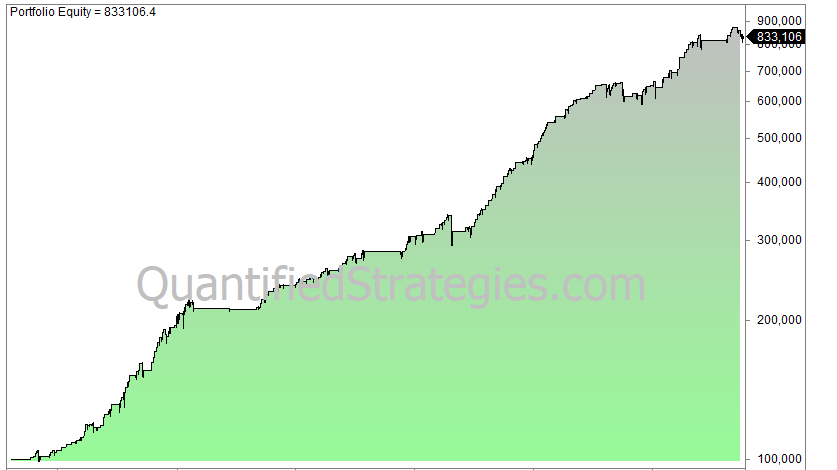
This strategy returns this equity curve in SPY from 1993 until today (SPY):
These are the facts about the strategy:
- The number of trades is 379 and the average gain per trade is 0.7%.
- The win ratio is 76%.
- CAGR is 8.7%, buy and hold is 9.8%.
- Max drawdown is 29%.
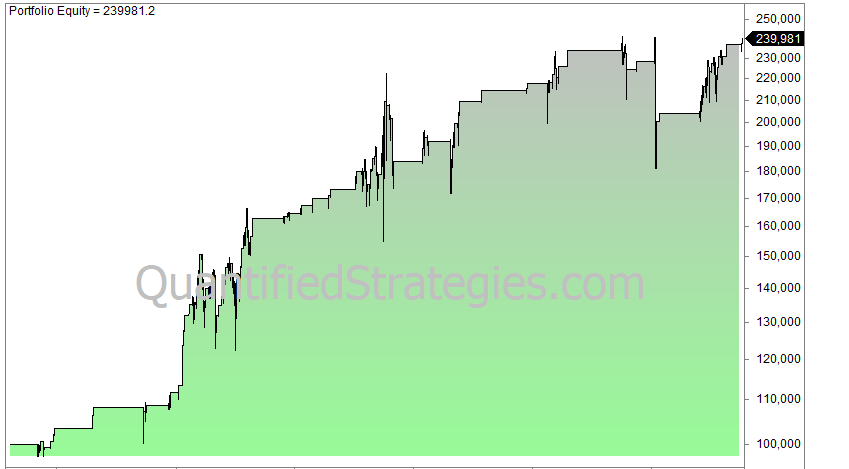
What happens if we add a 200-day moving average filter? The strategy is the same but the close needs to be above the 200-day moving average to generate a signal.
The equity curve gets slightly better:
When we add the trend filter, the strategy yields these numbers:
- The number of trades is 258 and the average gain per trade is 0.85%.
- The win ratio is 81%.
- CAGR is 7.1%, buy and hold is 9.8%.
- Max drawdown is 14%.
As you can see, the total return is lower because of fewer trades and less time spent in the market, but the upside is that you get a lower much lower drawdown and better win rate, which are very important to avoid trading biases and mistakes.
If we trade the strategy only when the close is below the 200-day average we get this equity curve:
- The number of trades is 138 and the average gain per trade is 0.7%.
- The win ratio is 68%.
- CAGR is 2.7%, buy and hold is 9.8%.
- Max drawdown is 25%.
200-day moving average crossover systems and strategies
Moving averages can also be employed in moving average crossover systems. A crossover system is, for example, if you use the 50-day and 200 day moving average and take trades when the shorter moving average (50-day) crosses above and below the longer moving average (200-day). You can even have a 3 moving average crossover strategy. Only your imagination limits the options!
Turtle trading strategies use crossover systems. Look at these two examples:
Volatility above and under the 200 day moving average
The price behavior in most markets is different depending on a bull or bear market. During a bull market volatility tends to go down, while in a bear market volatility picks up. There are many ways to create a 200-day moving average strategy.
If we look at the statistics of the S&P 500 the difference is huge: The daily percentage difference between high and low (compared to the closing price) has been like this from 1993 until the summer of 2021:
- Above the 200-day moving average: 1.05%
- Below the 200-day moving average: 2.1%
Clearly, the price action is completely different depending on the price being above or below the long-term moving average.
It might not be like this in all markets because we only looked at the stock market, however, we suspect this is a pattern that is not random.
Time spent above the 200-day moving average
Markets that have a long-term upward bias, like stocks and the price of gold, spend most of the time above the 200-day moving average.
For example, the S&P 500 has spent 70 percent of the time above since 1960 and 85% of the time since 2010. Again, the remarkable bull market since the GFC is, historically, a somewhat outlier, but who knows, this might be the new norm if the central bankers keep on printing money.
The 200-day moving average strategy and its whipsaws
The moving average would have done a great job in keeping you out of the markets in 2000-03 and 2007/09. However, it comes at a price:
There are plenty of whipsaws and false signals along the way. Since 1960 it has crossed above the average 187 times.
But astonishingly, only 28% of the trades turn out to be winners!
Are you able to trade a system with such a low win ratio? We would guess many would give up after a few losses in a row.
The strategy has a max of 9 consecutive losers. Are you able to pull the trigger on the tenth trade? The one that eventually turned out to be a big winner?
Only you can answer that, but our guess is that many couldn’t and would have abandoned the strategy earlier.
FAQ 200DMA
Based on the number of e-mails we get we decided to make a FAQ to better address any issues about the 200-DMA:
Which time frame is best for 200 DMA?
There is no best or worst time frame. Only a backtest can tell what works or not. But in general, daily bars are most frequently used. If you use weekly bars, a 200-day average is about 4 years of data, which is pretty long.
Should you buy below the 200-day moving average?
Again, only a backtest can tell you. But as indicated earlier in the article, the 200-day moving average has worked pretty well to filter trends in the stocks market.
What is best, SMA 200 or EMA 200?
Yet again, only a backtest can give a precise answer. But overall, we like to use SMA because it’s simple. Apart from that, please read our guide for the best moving average.
What does it mean when a stock goes below its 200-day moving average?
That means the stock enters a bear market. This doesn’t necessarily mean it’s not tradable, perhaps even the contrary, as we have successfully traded stock market indices when they are below their 200-day moving average.
How do you plot a 200DMA?
1. Gather the data points for the 200-day moving average. These data points are the 200-day average closing prices of a stock. 2. Plot the data points on a graph. 3. Connect the data points with a line. However, any software platform makes this in a hundredth of a second.
What’s the 200 DMA rule?
The 200-day MA is generally used as a long-term trend indicator, and traders often use it to determine whether a stock is in an uptrend or downtrend. If the price is above the 200-day MA, it is generally considered to be in an uptrend, and if it is below the 200-day MA, it is in a downtrend.
List of trading strategies
We started this blog as long ago as 2012. We have since then written over 800 articles that you can read for free – please see our complete list of trading strategies that work. The same list also contains day trading strategies. The strategies are an excellent resource to help you get some trading ideas.
We have compiled the Amibroker code and logic in plain English for all these strategies (plain English is for Python trading). If you subscribe, you’ll get the code for the latter strategy (plus over 200 other ideas).
For a list of the strategies we have made please click on the green banner:
These strategies must not be misunderstood for the premium strategies that we charge a fee for:

Conclusions about the 200-day moving average strategy:
This article has highlighted some facts about the 200-day moving average. It’s not the sexiest tool a trader and investor can use, but it’s still reasonably effective in filtering out noise. It’s a great universal tool for any market.
Moreover, as a trader, you might not be interested in beating a buy and hold strategy but simply use a 200-day moving average strategy to keep you out of trouble.
Glossary
- 200 MA (Moving Average): A widely used technical indicator that calculates the average closing price of a security over the past 200 trading days.
- Moving Average: A statistical calculation used to analyze trends by smoothing out price data over a specific time period.
- Long-term Trend: The overarching direction in which a security’s price is moving over an extended period, often identified using the 200 MA.
- Crossover: The event when a security’s price crosses above or below its 200DMA, potentially signaling a change in trend.
- Golden Cross: A bullish signal occurring when a security’s short-term moving average crosses above its 200 MA.
- Death Cross: A bearish signal occurring when a security’s short-term moving average crosses below its 200 MA.
- Support: A price level at which a security often finds buying interest, potentially coinciding with the 200 MA.
- Resistance: A price level at which a security often encounters selling pressure, possibly aligning with the 200 MA.
- Trend Reversal: A change in the direction of a security’s price movement, which may be indicated by a 200 MA crossover.
- Volatility: The degree of variation in a security’s price over time, which can be smoothed out by the 200 MA.
- Signal Line: A line plotted on a chart, often using the 200 MA, to help identify buy and sell signals.
- Confirmation: Additional indicators or analysis supporting the validity of a 200 MA-based trading decision.
- Moving Average Convergence Divergence (MACD): A momentum oscillator that can be used in conjunction with the 200 MA to identify potential trend changes.
- Simple Moving Average (SMA): A general term for moving averages, including the 200-day moving average.
- Exponential Moving Average (EMA): Another type of moving average that gives more weight to recent data points, often used alongside the SMA.
- Long-term Moving Average: Referring to any moving average with a relatively high number of days, like the 200-day moving average.
- Trend-following Indicator: The 200-day moving average is often used to identify and follow long-term trends in financial markets.
- Moving Average Convergence Divergence (MACD): A technical indicator that uses two moving averages, including a longer-term one like the 200-day moving average.
- Technical Analysis Signal: The 200-day moving average is used as a signal for various trading and investment decisions.
- Price Trend Indicator: It is used to assess the overall trend in the price of a security or asset over a long-term period.
- Market Momentum Gauge: Traders and analysts use the 200-day moving average to gauge the momentum of a market.
- Historical Price Average: It represents the average price of an asset over the past 200 days, serving as a reference point.
- Support and Resistance Level: The 200-day moving average can act as both support (when prices are above it) and resistance (when prices are below it) in technical analysis.
- Bull Market: A sustained period of rising prices, which may be confirmed by the 200 MA.
- Bear Market: A prolonged period of falling prices, potentially indicated by a 200DMA crossover.
- Whipsaw: A situation where a security’s price moves above and below its 200 MA in quick succession, causing false signals.
- Price Action: The behavior of a security’s price over time, often observed in relation to the 200 MA.
- Backtesting: Evaluating the historical performance of a 200 MA strategy using past data.
- Risk Management: Techniques to control potential losses when using the 200 MA strategy.
- Exponential Moving Average (EMA): A weighted moving average that gives more weight to recent prices, used alongside the 200 MA for analysis.
- Moving Average Ribbon: A collection of multiple moving averages, including the 200 MA, plotted on a chart to provide a more comprehensive view of trends.
- Market Sentiment: The overall mood and attitude of traders and investors, which can influence how the 200 MA is interpreted.
- False Signal: A trading signal generated by the 200 MA that does not lead to the expected outcome.
- Day Trading: A short-term trading strategy that contrasts with the long-term perspective of the 200 MA.
- Swing Trading: A trading style that aims to capture shorter-term price swings within the context of the 200 MA trend.
- Position Sizing: Determining the amount of capital allocated to a trade based on 200 MA-based signals and risk tolerance.
- Risk-Reward Ratio: Assessing the potential gain versus potential loss in a trade involving the 200 MA strategy.
- Lagging Indicator: The 200 MA is considered a lagging indicator because it is based on historical data.
- Leading Indicator: A measure that provides potential insight into future price movements, which may complement the 200 MA.
- Average True Range (ATR): A volatility indicator used alongside the 200 MA to gauge potential price movements.
- Divergence: When a security’s price moves in the opposite direction of its 200DMA, signaling a potential trend reversal.
- Reversion to the Mean: The tendency for a security’s price to return to its long-term average, such as the 200 MA.
- Pullback: A temporary decline in a security’s price within an uptrend, often seen in relation to the 200 MA.
- Breakout: When a security’s price moves decisively above or below its 200 MA, potentially indicating a new trend.
- Volatility Squeeze: A period of low volatility that can precede a significant price movement, which the 200 MA can help identify.
- Trendline: A line drawn on a chart connecting significant highs or lows, often used in conjunction with the 200 MA.
- Relative Strength Index (RSI): An oscillator measuring the speed and change of price movements, often used with the 200 MA.
- Moving Average Envelope: Bands plotted above and below the 200 MA to highlight potential overbought or oversold conditions.
- Risk-on/Risk-off: Market conditions where riskier assets are favored (risk-on) or shunned (risk-off), which can impact the 200 MA strategy.
- Position Trading: A long-term trading style that aligns with the 200 MA’s focus on long-term trends.
- Intraday Reversal: A change in direction during a single trading day, which may be influenced by the 200 MA.
- Market Timing: Using the 200 MA to determine entry and exit points in the market.
- Economic Indicators: External factors such as GDP, employment data, and inflation that can influence how the 200 MA is interpreted.
- Breakdown: When a security’s price drops below a key support level, potentially confirming a bearish trend.
- Breakout Confirmation: Ensuring that a price breakout above the 200 DMA is supported by other indicators before taking action.
- Sector Rotation: Shifting investments between different sectors based on the 200 MA’s signals.
- Risk Appetite: The willingness of investors to take on risk, which can impact the effectiveness of the 200 MA strategy.
- Market Downturn: A period of sustained market decline, potentially indicated by a 200 DMA crossover.
- Hedging: Using options or other strategies to protect against potential losses when employing the 200 MA strategy.
- Quantitative Analysis: Using mathematical models and statistical techniques to enhance 200 MA-based decision-making.